Trump stock market rally pausing before FOMC rate hike
I will update around 6:59 a.m.
The Emini rallied on the open and is Always In Long. Yet, the big bull bars had bad follow-through. In addition, the rally is a 3rd push up from Friday’s close. Furthermore, the Emini is in a buy climax on the 60 minute chart. Finally, the Emini will try to get neutral going into the FOMC meeting on Wednesday. Therefore, this initial rally will probably be a bull leg in a trading range.
Because the Emini has been strong, there is an increased chance of a strong trend day. Yet, the odds still make that unlikely. The Emini will probably close the gap on the 5 minute chart above the 11:15 high on Friday at 2249.75 at some point today. There is no evidence yet that today could be a bear trend day.
Pre-Open Market Analysis
The Emini had a big bull breakout last week. There was good follow-through buying on Thursday. While Thursday and Friday were smaller days, the did not reverse the bull breakout. As a result the odds are that the Emini will go higher for at least a week or two.
Because the Emini will probably go sideways into Wednesday’s interest rate hike, it is in breakout mode. Yet, the trend up is strong. As a result, even if there is a selloff after the rate hike, the reversal will be minor. That means that it more likely become a bull flag than a bear trend.
Overnight Emini Globex trading
The Emini rallied and then sold off overnight. It has been sideways for most of the night and is now unchanged. Because the daily chart is in a buy climax and there is a catalyst on Wednesday, bulls will probably take some profits. As a result, the upside will probably be small over the next few days. In addition. the Emini will likely pull back at least 20 points to test Thursday’s low. That is a reasonable target because it is the bottom of the 2 day bull channel on the 5 minute chart.
EURUSD Forex Market Trading Strategies
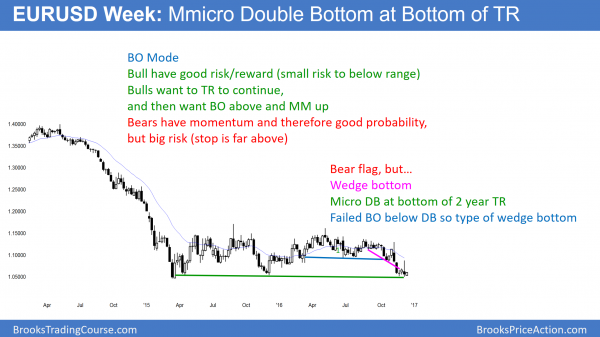
The EURUSD weekly chart is forming a micro double bottom at the bottom of a 2 year trading range. The location is good for the bulls, and the momentum is good for the bears.
The EURUSD daily chart reversed down from a wedge bear flag last week. Because it broke back above the bottom of the 4 month trading range, traders are less confident that the bears are in control. They should have prevented the rally from breaking above resistance. Furthermore, as strong as the selling was, it failed to fall below last week’s low.
As a result, the bulls are hoping that the EURUSD will form a higher low major trend reversal on the 240 minute chart. If it falls below the 3 week range, they will try for another reversal up. That would form a larger expanding triangle on the 240 minute chart.
Monthly EURUSD bear flag
The bears want Thursday’s break below the bear flag to be the resumption of the November selloff. Yet, unless the EURUSD falls strongly below last week’s low, the odds are that the 2 year trading range will continue. If the bears get a measured move down from the 350 pip tall trading range over the past 3 weeks, the EURUSD will fall below low of the past 2 years. That would also therefore be a new 14 year low. It will also increase the chances of the EURUSD falling to par (1.0000).
Breakout mode
The EURUSD weekly chart broke strongly below an 18 month triangle in November. Yet, it has been finding support at the bottom of the 2 year trading range. The momentum and therefore near-term probability favors the bears. They see he 4 week trading range as a bear flag. Because the stop is above the November bear sell climax, the risk is big. Therefore, the risk/reward it bad.
The bulls have low risk because their stop is below the bottom of the range, which is close. Their reward is also big, since it is to the top of the range.
Because the math is balanced between the bulls and bears, the EURUSD is in breakout mode. Since this Wednesday is an important catalyst, there could be a strong bear breakout or bull reversal this week.
Overnight EURUSD Forex sessions
The EURUSD rallied 80 pips overnight. This is an attempt at a major trend reversal up on the 240 minute charts. This is a reasonable swing long for the bulls with the stop below the overnight low. The overnight range is big enough for day traders to scalp for 10 – 20 pips today
As is the case whenever there is a trading range, it is also reasonable to be swinging a short trade. The swing stop for the bears is above last week’s high or the November high.
Summary of today’s S&P Emini futures price action and what to expect tomorrow
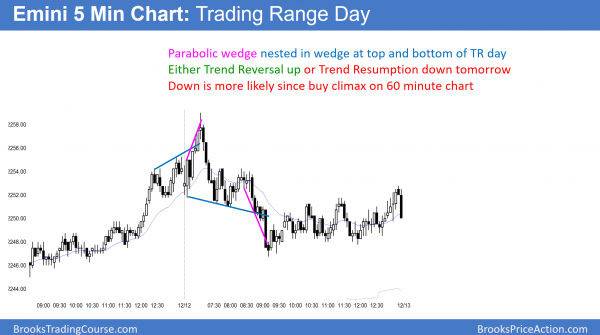
The Emini reversed down from a parabolic rally on the open. It then reversed up from a similar nested pattern, but failed to get above the open.
The Emini reversed down on the open from a parabolic wedge top at a new all-time high. Yet, the selloff was in trending trading ranges and therefore not strongly bearish. It will probably be quiet until Wednesday’s Fed interest rate hike. Because the Emini is so far above the moving average on the 60 minute chart, the odds favor a 2nd leg down to the average tomorrow.
See the weekly update for a discussion of the price action on the weekly candlestick chart and for what to expect going into next week.
Traders can see the end of the day bar-by-bar price action report by signing up for free at BrooksPriceAction.com. I talk about the detailed S&P Emini futures price action real-time throughout the day in the BrooksPriceAction.com trading room. We offer a 2 day free trial.
When I mention time, it is USA Pacific Standard Time (the Emini day session opens at 6:30 am PST, and closes at 1:15 pm PST). You can read background information on the intraday market reports on the Intraday Market Update page.


