Possible brief October stock market correction
Updated 6:55 a.m.
The Emini gapped up big, yet began with 2 bear bars. That reduced the chances of a bull trend for the 1st hour or two. While today still might be a bull trend day, the odds are that it will have to go sideways to down to the moving average first. Furthermore, because the 1st 2 bars has reasonable bear bodies, the odds of a strong bull trend day are less. As a result, the best the bulls probably can get is a weak bull trend.
While the bears began with a trend from the open bear trend, they need continued relentless selling if today is going to fail at the daily moving average and form a lower high double top with Friday’s high. The Emini is Always In Short, and the bears are trying to close the gap above yesterday’s high.
The initial selling is strong enough to make either a trading range or strong bear trend likely over the next 2 hours. Because the gap up was big and the selloff was also big, this is a Big Up Big Down pattern. The odds are that the Emini will soon bounce and go sideways. Yet, traders will sell the 1st rally. After that, traders will decide whether today will be a Spike and Channel bear trend that will close the gap, or a trading range day.
Pre-Open Market Analysis
Yesterday was a sell entry bar on the daily chart. Yet, the bear body was small and the signal bar was big. Furthermore, it was the 4th day in a 4 day tight trading range. The bears can hold short on the daily chart. Yet, the odds are that the Emini will go sideways to up for another day or two. If it does, it might then create a Low 2 sell signal.
Possible brief, fast move down to 2060 within 2 weeks
Because this bear flag is at the bottom of a month-long trading range, the probability for a successful bear breakout is only about 50%. Yet, there is still a 60% chance of filling the gap above the July 2015 high before rallying to a new high. Furthermore, there is a 70% chance of filling the gap before the Emini goes much about the prior high.
If the Emini falls below the double bottom, it could quickly fall 50 points to around the July 6 low. In addition, the selloff could take place over only 2 – 3 days. Yet, the odds are that bulls will buy it. Therefore, the bull trend would probably resume and reach a new all-time high. Since the monthly chart is in an extreme buy climax, the new high will probably not go much beyond 2400. The 2 year trading range will probably be the Final Bull Flag. If so, it would then lead to a year or more of sideways to down trading.
Overnight Emini Globex trading
I mentioned yesterday in the chat room that Friday’s rally was strong. Furthermore, I said that the Emini would probably rally back up to test it. The Emini is up 15 points in the Globex session. As a result, it will probably gap up on the open. The bulls need a strong breakout above Friday’s high to continue the reversal up from the double bottom on the daily chart.
Since the bears always want the opposite, they want this rally to fail at Friday’s high. As a result, the bears would create a Low 2 sell setup at the moving average. If the bears can then break below Thursday low (the 2nd low of the double bottom), the Emini will probably quickly fall below the July 2015 high.
Forex: Best trading strategies
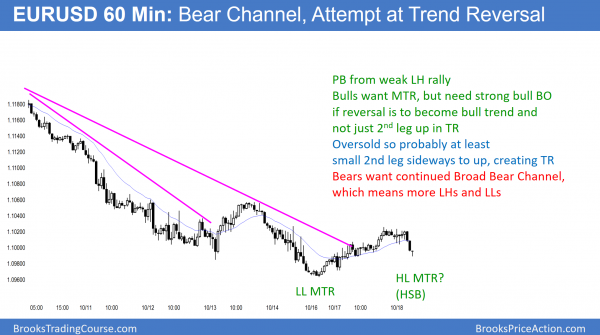
While the EURUSD 60 minute chart rallied twice in the past 4 days, the rallies have not been as strong as the selloffs. As a result, a trading range is more likely than a Major Trend Reversal (MTR). If the bulls get a reversal here, it would also be a Head and Shoulders Bottom (HSB).
The EURUSD 60 minute chart had a weak rally yesterday. It therefore was probably a minor reversal. Yet, it formed a micro double bottom and sell climax on the daily chart over the past week. Therefore, the odds are that the EURUSD Forex market will trade sideways to up for another day or two. At that point, it will choose between a break below the July 25 higher low and a rally up to the September 21 low. That was the breakout point of the September trading range.
The EURUSD Forex daily chart is trying to form a double bottom bull flag with the July 25 low. While the selloff of the past couple of weeks has been strong, the bulls think it is just a Sell Vacuum test of support. Since there is now a Micro Double Bottom, they are hoping for a 150 pip rally to test the bottom of the September trading range. Because the selloff was so strong, the bulls will probably need more sideways days or a strong bull breakout to achieve their goal.
Testing bottom of trading range
Since the EURUSD raced down to support and stopped, the bear case is not strong. Strong bear trends typically break below support before pausing. Furthermore, the market has been in a trading range for almost 2 years. While it eventually will break out, the odds of any attempt being successful are small. Therefore, this one will probably be like all of the others. As a result, it probably will fail to fall below the December 4 higher low.
While last week was a big bear trend bar closing on its low and breaking below a 2 month range on the weekly chart, the bears need follow-through selling. If this week is not another big bear trend bar closing near its low, the odds are that the bear breakout will soon reverse back up.
Overnight EURUSD Forex sessions
The EURUSD sold off overnight, but the range was only 35 pips. Furthermore, the selloff lasted only 2 hours and the market is now bouncing. The odds are that today will continue to hold support around the July 25 low today. Furthermore, it will continue to decide whether it will reverse up from the 60 minute reversal pattern. The bears want a bear flag and the bulls want a trend reversal.
Summary of today’s S&P Emini futures price action and what to expect tomorrow
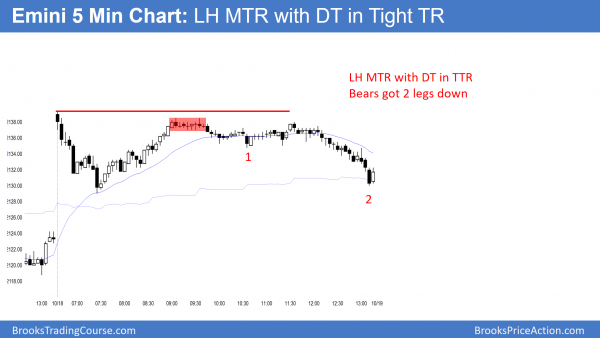
The Emini gapped up and sold off to close the gap. It then rallied from the moving average, and entered a tight trading range for several hours. After a lower high major trend reversal that had a double top in a tight trading range, it sold off into the close.
While the Emini reversed up from the moving average, it failed at the daily moving average. Furthermore, it is a micro double top with Friday’s high. Yesterday is therefore a Low 2 sell signal bar just below the moving average. Because the Emini has been in a trading range for months, the probability is that a bear breakout below yesterday’s low will not get far. In addition, if there is a bull breakout above Friday’s high, it too will probably not go far. The Emini is waiting for the results of the House and Senate Congressional elections, which are not yet certain. As they become more certain, the Emini could have a strong breakout up or down before the election.
Today rallied to a lower high and then formed a tight trading range. It then formed a small double top within that tight trading range. That was the sell signal for a lower high major trend reversal. What is especially relevant is that this is nested into a similar pattern on the daily chart. I wrote about it this past weekend and again several times in the past several weeks in my weekend blog. Because this pattern has a 40% chance of a surprisingly big 2nd leg down, like today, the daily chart has a 40% chance of a 50 – 80 point drop over the next 2 weeks.
See the weekly update for a discussion of the price action on the weekly candlestick chart and for what to expect going into next week.
Traders can see the end of the day bar-by-bar price action report by signing up for free at BrooksPriceAction.com. I talk about the detailed S&P Emini futures price action real-time throughout the day in the BrooksPriceAction.com trading room. We offer a 2 day free trial.
When I mention time, it is USA Pacific Standard Time (the Emini day session opens at 6:30 am PST, and closes at 1:15 pm PST). You can read background information on the intraday market reports on the Intraday Market Update page.


