Posted 7:10 a.m.
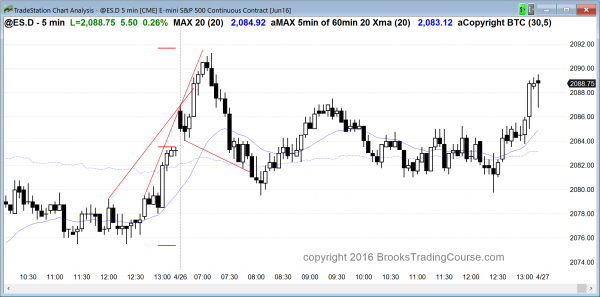
The Emini gapped above yesterday’s high triggering a High 1 bull flag buy signal on the daily chart. Limit order bears could not make any money in the 1st 30 minutes. Even though the Emini has had a series of buy climaxes since the last hour of yesterday and it testing the top of the 3 day trading range, the absence of selling pressure means that the 1st pullback will probably be bought. This a possible parabolic wedge top and a reversal down. The best the bears will get over the next hour is a tight bear channel that lasts 5 – 10 bars. The bull will try for trend resumption up, and the bears want a bear breakout below the bear channel, and then trend resumption down.
Although the Emini is Always In Long, it will probably enter a tight trading range or tight bear channel for about 10 bars before it decides whether to resume up or reverse down. The bears need a strong bear breakout. After a parabolic wedge top, that Give UP breakout (bulls giving up) usually does not come for at least a couple of hours,
Pre-Open Market Analysis
S&P 500 Emini: Learn how to trade TR price action before FOMC
As a side note, one of my daughters graduates from the Harvard Business School in a few weeks. She started an online non-profit last year and entered it in a competition at Harvard. She made it to the finals, which are today, around 2 pm, PST. The winner is chosen by the faulty. There is a consolation prize that is determined by online voting. If you think about it around 2 pm today, please go to this link: [removed – voting ended]
The voting is not there yet, but it will appear around 2 pm today. The time window will probably be only 30 minutes. If you can help here, just go to the link and look at that page for something that says Vote. If you find it, please vote for TESS BROOKS, or for her company, CONFI.CO (not .com). She is an absolutely exceptional person in every way, and this is a chance for me to try to help her out as she is about to enter the business world in a few weeks. Even though she is in school, she flew out to be with me for surgery, and it flying out to be with me next week as I recover and deal with my new life.
The Emini had small trading range days over the past 2 days. Today is likely to be the same, especially since tomorrow is an FOMC report day. The weekly chart is unusually overbought. It is in an 11 bar micro channel. There is a 90% chance of the Emini either trading below last weeks low this week, or below this week’s low next week. Once it does, it will then probably go sideways for a few weeks.
The micro channel is also a sign of strength. The odds are that the pullback will be bought. Also, the Emini on the daily chart reversed down after breaking above the July all-time high, and it has not rallied back up to test that high. The odds are that it will get back up there again. If might do it on the report tomorrow, or it might take a month or more to get there. The odds are that it will get there before there is a significant correction.
The Emini has a 60% chance of at least a 20% correction this year because of how overbought it is. The daily chart has a potential Final Bull Flag. If the bulls instead get their bull breakout, the 2 year trading range on the monthly chart will then probably be a Final Bull Flag. This means that the bull breakout on the monthly chart will probably fail within 5 bars (months), and then test at least to the bottom of the flag. That is the low of the 2 year trading range, and it is around 1,800.
All markets like surprises. The surprise today would be a strong trend up or down. If there is a strong breakout, traders will swing trade part of their position. The odds are that traders will be resistant to swing trading because a trading range day is more likely, but good traders never worry about what is likely or unlikely. Price is truth. If there is a trend, they eventually will trade it appropriately.
In the meantime, the odds favor a continuation of the trading of the past few days. The market spent a lot of time in narrow ranges, and traders mostly traded with limit orders. The 60 minute chart has had a Big Up, Big Down candlestick pattern over the past 2 weeks. This is usually followed by a trading range, and then either trend resumption up or trend reversal down. A trading range began a couple of days ago, and it does not look big enough yet. This also increases the chances of more trading range price action today.
Forex: Best trading strategies
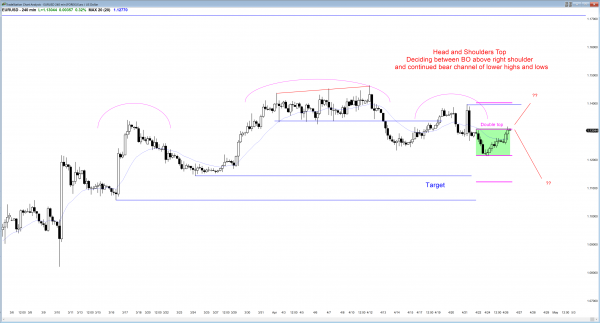
240 minute EURUSD chart is in breakout mode. The bulls need a break above the 1.1400 right shoulder to end the Head and Shoulders Top. The bears need to keep forming lower highs and lows.
The EURUSD Forex rallied to the top of the April 21 small bear leg. This was the 1st pullback from the huge reversal down earlier in the day. The bears want a double top with that pullback, and then a break below the neckline of the double top. That is the April 24 low of 1.1242. If the bears succeed, the bears need to continue to form lower highs and lows, which is the hallmark of a bear trend.
The bulls always want the opposite. Most reversals fail, and last week’s break below the neck line of the Head and Shoulders top was weak. The Forex market has been going sideways instead of down. To make the bears give up, the bulls need a break above the right shoulder. That lower high came on April 21 and it was around 1.1400.
The bulls rallied over the past 2 hours and are trying to break above the April 21 small lower high. The bulls need follow-through. Otherwise, there is still a potential small double top bear flag. The rally has already gone far enough above the 1st top by enough to probably eliminate the pattern. Instead, it looks like it is trying to test the top of the right shoulder, around 1.1400. The two hour rally has a series of buy climaxes within it. That increases the chances of at least a couple hours or trading range price action. Without a much stronger bull breakout or a strong bear reversal, the odds are that bulls and bears will make 10 – 20 pip scalps today. It is unlikely that it will go very far in the middle of a month-long trading range when there is an FOMC report tomorrow. Even though a strong trend is not likely, if one comes, traders will swing trade, and not question the breakout.
Summary of today’s S&P Emini futures price action and what to expect tomorrow
The Emini reversed down from a parabolic wedge top on the open and entered a trading range.
The Emini spent most of the day in a tight trading range. It is probably waiting for tomorrow’s FOMC announcement at 11 am. The odds are that it will test the July high again soon. However, because the weekly chart is so overbought, the odds also favor a pullback on the weekly chart within the next 2 weeks. Tomorrow will probably be another quiet day until the FOMC report. It then will probably have a big move. The move can be up, down or in both directions so day traders have to be willing to follow the momentum.
See the weekly update for a discussion of the price action on the weekly candlestick chart and for what to expect going into next week.
Traders can see the end of the day bar-by-bar price action report by signing up for free at BrooksPriceAction.com. I talk about the detailed S&P Emini futures price action real-time throughout the day in the BrooksPriceAction.com trading room, and a 2 day free trial is available.
When I mention time, it is USA Pacific Standard Time (the Emini day session opens at 6:30 am PST, and closes at 1:15 pm PST). You can read background information on the intraday market reports on the Intraday Market Update page.


