Posted 7:02 a.m.
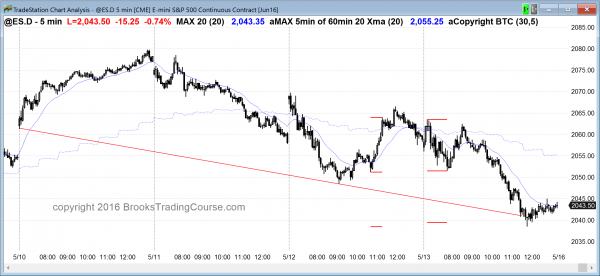
The Emini rallied on the open after a breakout test of yesterday’s 10:05 a.m. breakout point. The Emini will probably get a 2nd leg up today and reach a Leg 1 = Leg 2 target, but the bear channel at the end of yesterday was tight. This often means that the bulls need a double bottom before the 2nd leg up begins. The bears quickly got the test.
The bears are hoping that yesterday’s rally was a trap and that they can get below the bottom of the the bull breakout that began at 10:40. As long as the bulls are able to hold above that low, they probably will maintain an advantage. However, there is plenty of room for a swing down to that low for bears to make money.
The Emini is barely Always In Long, but all 3 moving averages are flat and the Emini has not broken away from them. This increases the chances of sideways trading for the next hour. The bears are testing the opening low. If they fall below, the next target is the bottom of the strong rally form yesterday. If the bears break below that, today could be a big bear trend day.
The controlling force is still yesterday’s bull reversal. Unless the bears break strongly below it, it will still give the bulls a slight edge. The repeated reversals over the past hour increase the chances of a lot of trading range price action today. The strong reversal down might result in a test down to the bottom of yesterday’s bull reversal. The odds overall still favor a 2nd leg up after yesterday’s reversal. The bulls are trying to find the bottom of the pullback, and it might be below the current price.
Pre-Open Market Analysis
S&P 500 Emini: Learn how to trade a triangle candlestick pattern
The Emini had a strong enough reversal up yesterday to make a Leg 1 = Leg 2 measured move up likely today, despite the overnight selloff. However, the Emini is in the middle of a 3 week trading range. On the 60 minute chart, there is both a clear double top with the May 2 and May 10 highs, and a clear Head and Shoulders Bottom that began with the April 29 left shoulder. When there are clear opposite patterns, the market is balanced, confused, in a trading range, and in breakout mode. Neither side has an advantage as to the direction of the breakout.
Yesterday’s reversal up is also creating a triangle on the daily chart. The 1st push down is the April 7 low and the 2nd is May 6. However, the Emini is already in breakout mode so calling it a triangle candlestick pattern does not change the meaning of the price action. The daily chart, like the 60 minute chart, is in breakout mode.
While the bulls have a short-term advantage today after yesterday’s strong reversal up, that is a pattern on the 5 minute chart. It is not enough to overwhelm either the bull or bear patterns on the 60 minute charts.
Today is a Friday so weekly support and resistance can affect the price action, especially late in the day. The nearest magnet is this week’s open at around 2050, and the low of the week just below that.
The weekly chart had an 11 week bull micro channel that ended with the pullback 2 weeks ago. The weekly chart has been sideways since. The micro channel is a sign of strong bulls, and it makes a bear reversal unlikely until after a least a test of the top of the channel, which is the All-time high from last month. This means that a test up is more likely than a reversal down at some point in the next couple of weeks.
One of the big problems facing the bulls is the untested April low on the monthly chart. April is a sell signal bar on the monthly chart and the context at the top of a trading range is good for the bears. The market usually wants to test at least a little below that sell signal bar to see if there are buyers or sellers. This is part of the reason why the Emini bulls are hesitant,
However, the 5 minute reversal yesterday was unusually strong enough to make it likely that the bulls will have at least a Leg 1 = Leg 2 measured move rally today. Whenever something is obvious, there is always a potential pain trade. This means that the market relentlessly does the opposite. It does not matter that a 2nd leg up is likely if instead the Emini sells off. Traders should only sell. Price is truth.
Forex: Best trading strategies
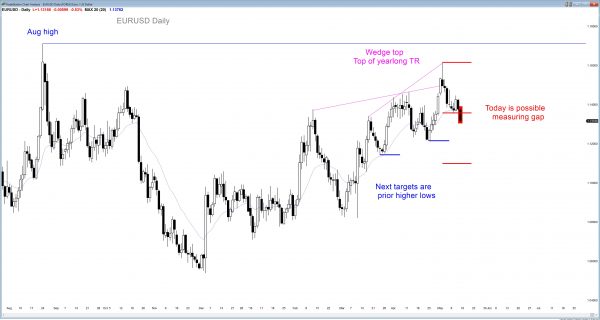
The daily EURUSD Forex chart is gapping below yesterday’s low. The gap is the space between today’s close and the low of 3 days ago.
The 60 minute and daily EURUSD Forex charts had been in tight trading ranges and broad bear channels for 6 days. The bulls and bears were almost balanced, but last night’s bear breakout is a reminder that the bears have a slight edge as long as the channel continues to make lower highs.
The daily chart had a Big Up, Big Down candlestick pattern, which is usually followed by a trading range. The bears are still winning and there is no sign of a bottom yet.
The weekly chart had a good looking wedge top at the top of the yearlong trading range, and this week is the entry bar. Although this week is a bear trend bar, it is not yet big. Today is the last day of the week. There is a small chance that today could be a big bear trend day, which would turn the weekly entry bar into a strong bear trend bar. This would increase the chances of at least 2 legs down on the weekly chart.
I mentioned yesterday that the 60 minute chart was forming a higher low major trend reversal. I also made the point that 60% of major reversals fail. Today made it clear that yesterday’s bottom was an example.
The selling on the 60 minute chart over the past 7 days has come in the form of brief breakouts and then bull bars or trading ranges. This is more typical of a bear leg in what will become a trading range rather than a bear trend. There is no sign yet of a bottom, but unless the bears are able to create consecutive big bear trend bars, the odds still favor more trading range trading over the next couple of weeks. Although the daily and weekly charts look good for the bears, the 60 minute chart looks less good, and the 5 minute chart is not strongly bearish at all. It could easily rally and undo the selling of the past hour. The odds are that the 5 minute chart will be mostly sideways today because that is how it has behaved after every strong breakout over the past 7 days.
The bears got a breakout on the daily chart last night. There is a gap between today’s close and the low of 3 days ago. The bigger the bear trend bar becomes today, and the more it closes on its low, the more likely today will be a measuring gap. The bears then also need a bear bar on Monday. That follow-through selling would increase the chances of a measured move down. If instead Monday is a bull bar, or the EURUSD rallies above the low of 3 days ago, the gap will close and a trading range will be more likely than a measured move down.
Summary of today’s S&P Emini futures price action and what to expect tomorrow
After attempting to get a 2nd leg up after yesterday’s strong bull reversal, the Emini reversed below the low of yesterday’s bull swing and fell for a measured move down. It bounced at the end of the day from a nested wedge bottom.
The Emini sold off in a small pullback bear trend and reversed up at a measured move down to a 3 day wedge bottom. The 60 minute bulls see this as a higher low major trend reversal (Head and Shoulders Bottom). Until there is a strong reversal up, the bears will continue to try to push below the 2026 April low. I have mentioned this repeatedly. The monthly chart has a sell signal and it triggers below that April low. It will probably trigger this month. The rally from the February low was so strong that the odds are that there will be buyers below, but many bulls are hesitant to buy until they see just how strong the bears are when they trigger that sell signal.
Today was a sell climax. There is a 50% chance of follow-through selling in the 1st 2 hours on Monday. Monday could even gap below the Head and Shoulders Bottom and trigger the monthly sell signal below the 2026 April low. There is a 25% chance of a strong bear trend. There is a 75% chance of at least a couple of hours of sideways to up trading beginning before the end of the 2nd hour. Because of the possibly major trend reversal, there could be a strong rally next week. More likely, the Emini will continue mostly sideways.
See the weekly update for a discussion of the price action on the weekly candlestick chart and for what to expect going into next week.
Traders can see the end of the day bar-by-bar price action report by signing up for free at BrooksPriceAction.com. I talk about the detailed S&P Emini futures price action real-time throughout the day in the BrooksPriceAction.com trading room, and a 2 day free trial is available.
When I mention time, it is USA Pacific Standard Time (the Emini day session opens at 6:30 am PST, and closes at 1:15 pm PST). You can read background information on the intraday market reports on the Intraday Market Update page.


