FOMC Fed interest hike rally testing all-time high
Updated 6:46 a.m.
Today opened with a doji bar in the middle of yesterday’s reversal. This is a trading range open and it increases the odds that the trading range after yesterday’s buy climax has begun. Furthermore, it increases the odds that today will be a trading range day.
Because yesterday was a strong bull trend day, there is still a 50% chance of a rally in the 1st 2 hours. In addition, there is an increased chance of a rally in the final hour.
At the moment, the Emini is barely Always In Long and the bulls are trying to create an Opening Reversal up from the moving average. The buy signal bar is bad. In addition, yesterday ended with a strong reversal. Furthermore, the Emini is in the middle of the reversal. These factors make a trading range open likely.
The bears want a lower high major trend reversal, but there are not yet enough bars for a major reversal down. The bulls want trend resumption up, but they need a better buy signal bar and a strong bull breakout.
Pre-Open market analysis
The Emini rallied after yesterday’s FOMC Fed interest rate hike. Yet, the rally was a wedge top and a series of buy climaxes. This is therefore likely to evolve into a trading range. Hence, the Emini is still in its 3 week trading range. Furthermore, the odds favor another reversal down within a day or two. The bears will try to prevent the Emini from going above the all-time high and the 2400 Big Round Number.
Because the weekly all-time high is far above the weekly moving average, any rally over the next week will probably stall. There is still a 60% chance of a selloff to the December close over the next 2 months.
Overnight Emini Globex trading
The Emini is up 3 points in the Globex market. Because yesterday had a strong buy climax, there is a 50% chance of follow-through buying in the 1st 2 hours today. In addition, there is a 75% chance of at least 2 hours of sideways trading that starts by the end of the 2nd hour.
Furthermore, because the weekly chart is so far above its average price, a rally will probably not get too far over the next few days. This is despite the seasonal tendency for the market to rally in the 2nd half of March.
EURUSD Forex market trading strategies
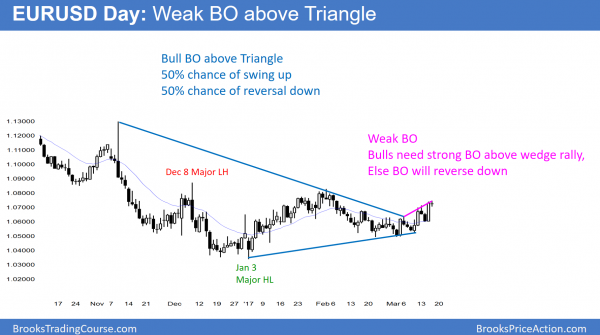
While the EURUSD daily Forex chart broke above a triangle, the breakout is weak. Furthermore, it is a small wedge bear flag.
INSERT PREMARKET FOREX ANALYSIS
The EURUSD daily chart broke above a 5 month triangle, but the breakout was weak. Furthermore, the follow-through after additional bull trend bars was weak. The rally is now a wedge bear flag. There is still a 50% chance of a strong breakout above the wedge bear flag. Hence, there is still a 50% chance that the triangle breakout will be the start of a swing up. In addition, there is also a 50% chance that the triangle breakout will reverse and break to the downside.
Overnight EURUSD Forex trading
The EURUSD rallied yesterday after the Fed interest rate hike. Yet, it has been in a 30 pip range for the past 6 hours. This is bad follow-through buying, and not typical of a successful bull breakout.
While the small trading range is a bull flag on the 240 minute chart, the breakout is the 3rd push up. If the bulls continue to get breakouts with bad follow-through, they eventually sell out of their longs and wait to buy lower. As a result, wedge rallies reverse down 50% of the time.
If the bulls do not get a strong breakout above this wedge bear flag in the next 3 days, the breakout above the triangle on the daily chart will probably reverse down.
There is an increased chance of a big move up or down over the next few days. But, because of the small overnight range, traders will scalp until they see a strong breakout.
Summary of today’s S&P Emini futures price action and what to expect tomorrow
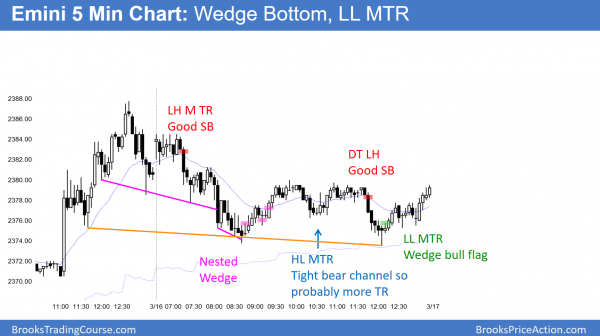
After a selloff to a wedge bottom, the Emini formed a triangle for 3 hours. The bears got trend resumption down. The bulls reversed up from a 2 day wedge bottom at the 60 minute moving average at the end of the day.
Today reversed most of yesterday’s gains, yet held above yesterday’s bull breakout. The bulls see today as a wedge bull flag pullback from yesterday’s strong rally. The bears see it as a lower high major trend reversal on the 60 minute chart. Since the odds still favor a test of the all-time high before a correction down to the December close, today is more likely just a leg in the 3 week trading range. The odds still favor at least a little higher on the daily chart to test the all-time high before the 5% correction.
See the weekly update for a discussion of the price action on the weekly candlestick chart and for what to expect going into next week.
Traders can see the end of the day bar-by-bar price action report by signing up for free at BrooksPriceAction.com. I talk about the detailed S&P Emini futures price action real-time throughout the day in the BrooksPriceAction.com trading room. We offer a 2 day free trial.
When I mention time, it is USA Pacific Standard Time (the Emini day session opens at 6:30 am PST, and closes at 1:15 pm PST). You can read background information on the intraday market reports on the Intraday Market Update page.


