Emini wedge top and buy climax at 2600 Big Round Number
Updated 6:44 a.m.
The Emini opened with a big gap down. The 1st 2 bars were big bars with big tails. The bull bodies make a Big Down, Big Up, Big Confusion pattern, which usually leads to a trading range. The tails are typical when a market is entering a trading range. The odds therefore are that the Emini will be mostly sideways for the 1st hour or more. In addition, this type of open lowers the chances of a big trend day up or down. The bears will try to get a double top or wedge bear flag just below the moving average. Less likely, they will get a trend from the open bear trend and a huge bear trend day. The bulls want a double bottom or wedge bottom, and then a reversal up.
At the moment, the Emini is Always in short. The odds favor either a bear trend day or a trading range day. The early big bull dojis make a trading range for the 1st hour likely.
Pre-Open market analysis
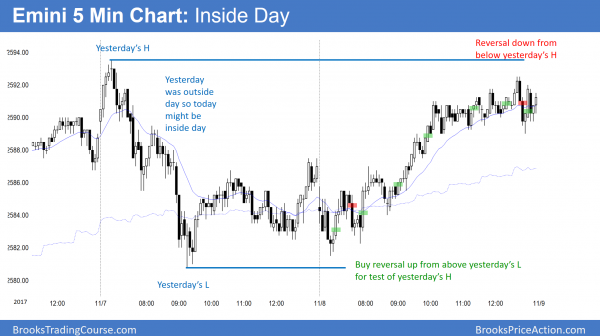
The Emini formed an inside day yesterday. It is therefore both a buy signal bar and a sell signal bar for today. The bulls want the 2 week channel to continue and will buy above yesterday’s high. The bears see yesterday as a sell signal bar for a wedge top on the daily chart. However, until they get a strong reversal down, the odds are that the bulls will buy every reversal. Yet, the odds are that the buy climax will begin a 5% correction before the end of the year.
The current political problems involving Trump’s tax reform and the budget could be the catalyst for the selloff. The first target for the bears is the October 25 low at the bottom of the wedge. If they break below there, they would look for a 40 pip measured move down. That would be around the 20 week exponential moving average and the 2500 big round number. If a selloff got there, it would probably continue lower to below 2500 and the August 8 breakout high. That would be about a 5% correction.
Overnight Emini Globex trading
The Emini is down 12 points in the Globex market. Yesterday was a bull bar on the daily chart and therefore a weak sell signal bar. Yet, the daily chart has a 3 week wedge top in an extreme buy climax. Traders should therefore be ready for a big bear day at any time.
Yesterday’s setups
Here are several reasonable stop entry setups from yesterday. I sometimes also show limit order entries and entries on the close of bars.
EURUSD Forex market trading strategies
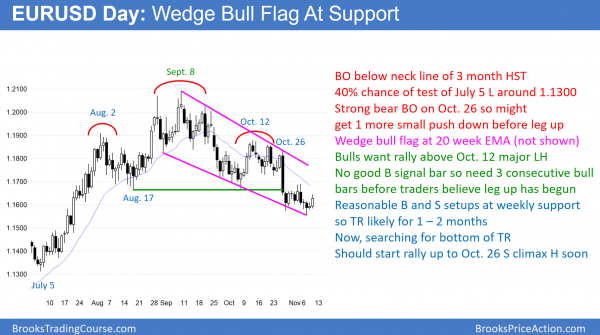
The EURUSD daily Forex chart broke below a 3 month head and shoulders top. It therefore has a 40% chance of a 400 pip measured move down. It has been in a bear channel for 2 months, but a bear channel is a bull flag. In addition, it is slightly convergent and therefore a wedge bull flag. Since there are both good buy and sell setups, the odds are that it will continue in a trading range for at least 1- 2 more months.
The Daily EURUSD Forex chart broke below a head and shoulders top. The bears want a 400 pip selloff. That would test below the top of the 2015 – 2016 trading range, and test the July 5 pullback low. Yet, most breakouts fail. Furthermore, it is testing its 20 week EMA (I showed this yesterday). Finally, the follow-through selling after the October 26 big bear bar has been bad. Consequently, the daily chart is more likely to rally about 250 pips up to the October 26 sell climax high before falling the same amount.
However, yesterday was a doji and therefore not a strong buy signal bar. In addition, the October 26 selloff was strong. The bears might therefore get one more small leg down before a reversal up begins. If so, that would create a nested wedge bottom. It would be a 2 week wedge bottom at the end of a 3 month wedge bull flag. If there was then a reversal up, it would have a higher probability of leading to a rally lasting 1 – 2 months and testing the October 26 high.
Any rally would probably stall around the October 12 major lower high, which is also around a 50% pullback from the 2 month selloff. Consequently, the odds are that the EURUSD will probably be mostly sideways for at least a couple more months.
Overnight EURUSD Forex trading
The 5 minute chart rallied 50 pips over the past 2 hours. The bulls are hoping that this is the start of a reversal up from a 2 month wedge bull flag. Yet, 50 pips is not strong enough to convince traders that the 2 month selloff has ended. In addition, most days over the past 2 weeks have been small or sideways. Therefore, another small day is likely again today. The bears might get one more leg down for a few days before the reversal begins. Yet, if the bulls get a stronger rally that what began 2 hours ago, traders will begin to swing trade for a 300 pip rally to the October 12 high.
Most bears are buying back their shorts since the past 2 weeks lacked follow-through. In addition, they have switched to scalping. They need a strong breakout below Tuesday’s low before they will again believe that the daily chart is working down to 1.1300. Without it, they will not swing trade again until there is a rally up to the resistance around 1.1850.
Summary of today’s S&P Emini futures price action and what to expect tomorrow
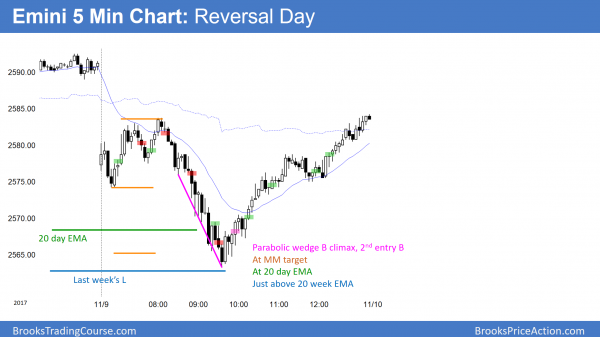
The Emini gapped down and sold off from a wedge bear flag at the moving average. It then reversed up to the open after a parabolic wedge selloff. It closed near the high and formed a bull reversal day at the 20 day EMA and just above last week’s low.
The bears got a wedge bear flag opening reversal down from the moving average. However, the bulls bought the selloff, which was a test of the daily moving average and last week’s low. Like most reversal days, it closed near the high and formed a bull reversal day.
The bulls see today as a double bottom with last week’s reversal. It is a buy signal bar. The bears need a strong bear breakout and follow-through before they will be willing to sell low.
See the weekly update for a discussion of the price action on the weekly candlestick chart and for what to expect going into next week.
Traders can see the end of the day bar-by-bar price action report by signing up for free at BrooksPriceAction.com. I talk about the detailed S&P Emini futures price action real-time throughout the day in the BrooksPriceAction.com trading room. We offer a 2 day free trial.
When I mention time, it is USA Pacific Standard Time (the Emini day session opens at 6:30 am PST, and closes at 1:15 pm PST). You can read background information on the intraday market reports on the Intraday Market Update page.


