Trading Update: Monday June 7, 2021
Emini pre-open market analysis
Emini daily chart
- Friday triggered High 1 buy signal and closed on its high.
- Since Friday closed just below all-time high, in wedge rally test, it might gap up to new all-time high today.
- Friday could not break to all-time high, so possible double top with May 7 high.
- Bears need strong reversal down from here, or from a failed breakout above May high.
- If a breakout above the May high reverses down this week, there will be a wedge top with the May 14 and June 1 highs.
- Wedge rally to a double top is a reasonable sell signal, but most reversals fail, so only buy a bull breakout on the daily chart for a swing trade.
- Until there is a clear, strong reversal down, traders will continue to expect new highs.
Overnight Emini Globex trading on 5-minute chart
- Up 3 points in Globex session, but just below the May 7 all-time high, so might gap up and go to a new high today. There would then be a gap up on the weekly chart as well.
- If there is a gap up, it will probably be small. Small gaps typically close in the 1st hour.
- Since the Emini is at the top of a 2-month trading range, it is in Breakout Mode. It is now testing the top of the range, and there is therefore an increased chance of a strong trend day up or down.
- Friday was a buy climax day, and so there is a 75% chance of at least a couple hours of sideways to down trading, that starts by the end of the 2nd hour.
- If today is going to be a trend day, there will probably be a series of strong trend bars in the 1st hour.
- If today is a bull trend day, and it breaks above the May high, there is an increased chance of a midday reversal down, since breakouts in general fail half the time.
Friday’s Emini setups

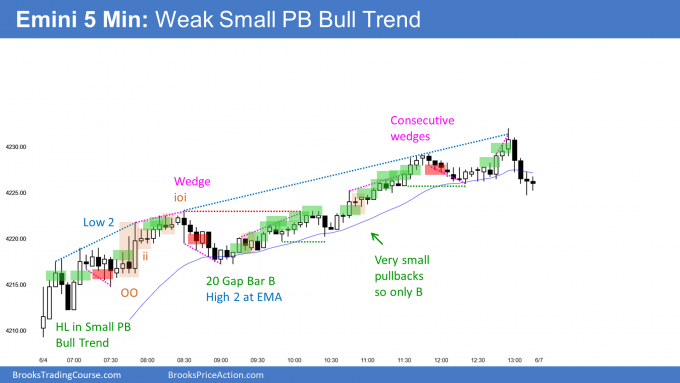
Here are several reasonable stop entry setups from Friday. I show each buy entry with a green rectangle and each sell entry with a red rectangle. Buyers of both the Brooks Trading Course and Encyclopedia of Chart Patterns have access to a much more detailed explanation of the swing trades for each day (see Online Course/BTC Daily Setups).
My goal with these charts is to present an Always In perspective. If a trader was trying to be Always In or nearly Always In a position all day, and he was not currently in the market, these entries would be logical times for him to enter.
If the risk is too big for your account, you should wait for trades with less risk or trade an alternative market like the Micro Emini.
EURUSD Forex market trading strategies
EURUSD Forex daily chart

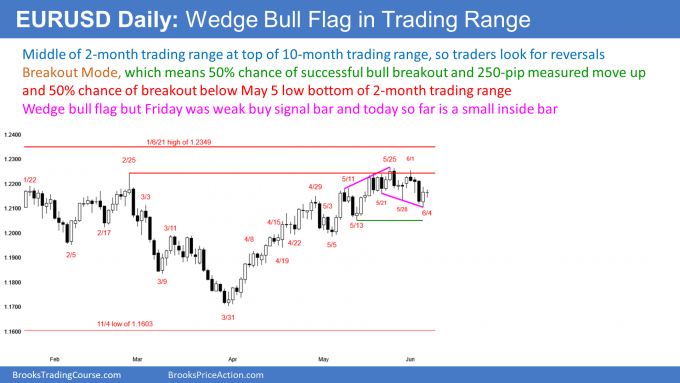
- Friday is High 2 buy signal bar, and a wedge bull flag buy signal bar.
- But it had a prominent tail on top, it followed a big bear bar, and it is in the middle of a 2-month trading range. This lowers the probability of a strong move up today.
- Today so far is a small inside doji bar, and there is therefore no evidence of a big move up or down.
- 2-month trading range is Breakout Mode.
- Bulls want a breakout above, and a 200-pip measured move up to above the February 2017 high, which is the top of a 7-year trading range.
- Bears want break below May 5 low at the bottom of the range, and a measured move down to around the March 31 low.
- Slightly more bullish than bearish, but still close to 50% chance of bear breakout.
- Traders continue to look for reversals every few days.
Overnight EURUSD Forex trading on 5-minute chart
- Today so far has a small range, and there have been several reversals. Day traders have been scalping up and down.
- Even though Friday is a buy signal bar, today has not gone above Friday’s high.
- Unless there is a series of strong trend bars in either direction, day traders will continue to scalp today.
- Because Friday is a weak buy setup, there might be more sellers than buyers above Friday’s high.
- Unless there is a strong breakout above Friday’s high, day traders will look to sell a reversal down from above Friday’s high.
Summary of today’s S&P Emini futures price action and what to expect tomorrow

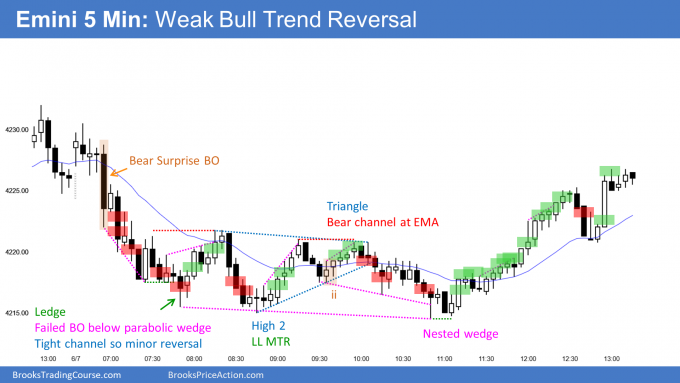
- Bear Trend From The Open. Reversed down from just below all-time high and from Globex high.
- Entered trading range above Globex low and yesterday’s low.
- Reversed back up to above midpoint of day’s range and closed in middle of day.
- Today was one of the 10% of days that do not break out of the Globex range.
- Today was an inside day on the daily chart.
- It had a bear body and it is therefore a low probability buy signal bar.
- It came after 2 big bull days and it had a prominent tail below. It therefore is not a strong sell signal bar.
- That makes sideways likely tomorrow.
- The bulls are still trying to break above the 10-week trading range. At some point, if they continue to fail, they will give up. That would create a reversal down.
- The odds still favor the bull breakout to another new all-time high.
Here are several reasonable stop entry setups for today. I show each buy entry with a green rectangle and each sell entry with a red rectangle. Buyers of both the Brooks Trading Course and Encyclopedia of Chart Patterns have access to a much more detailed explanation of the swing trades for each day (see Online Course/BTC Daily Setups).
My goal with these charts is to present an Always In perspective. If a trader was trying to be Always In or nearly Always In a position all day, and he was not currently in the market, these entries would be logical times for him to enter.
If the risk is too big for your account, you should wait for trades with less risk or trade an alternative market like the Micro Emini.
End of day summary
- I will update at the end of the day.
See the weekly update for a discussion of the price action on the weekly chart and for what to expect going into next week.
Trading Room
Traders can see the end of the day bar-by-bar price action report by signing up for free at BrooksPriceAction.com. I talk about the detailed S&P Emini futures price action real-time throughout the day in the BrooksPriceAction.com trading room. We offer a 2 day free trial.
Charts use Pacific Time
When I mention time, it is USA Pacific Time (the Emini day session opens at 6:30 am PT, and closes at 1:15 pm PT). You can read background information on the intraday market reports on the Market Update page.

