Emini trend resumption down to March 2 low around 2650
Updated 6:45 a.m.
Today opened with a big gap down and a bear bar. However, the low was a Leg 1 = Leg 2 measured move from Monday’s selloff. In addition, it was a measured move down from yesterday’s range. Finally, it was a test of the 2017 close. This is a possible low of the day.
The 2nd bar reversed up but could not close on its high. However, this is a possible low for the 1st hour. The bears will try for a wedge or double top bear flag at the moving average. The bulls want a double bottom or a higher low major trend reversal. Since the 1st 2 bars both have tails, both are weak. This increases the chances of a trading range open and a sideways to up move to the EMA over the 1st hour. Those 2 bars also reduce the chance of a strong trend day up or down.
Pre-Open market analysis
The Emini rallied strongly yesterday to above Monday’s high. This triggered a buy signal on the daily chart. Yet, after 7 bear days, the odds were that there would be more sellers than buyers above Tuesday’s high. The weekly chart is still on a sell signal after breaking below last week’s low. The market is deciding whether the 6 bar selloff on the daily chart is a bull flag or the start of a swing down. Because the monthly chart is so bullish, the odds favor a new all-time high by the end of April, whether or not there is a test down to the March 2 low 1st.
The bar on the weekly chart closes tomorrow. The bulls want a rally to above last Friday’s low, which would close the gap on the weekly chart. A gap up on any day will create an island bottom on the daily chart. This would negate the 6 day island top.
The bears want the week to close on its low. That would be a strong entry bar for the weekly sell signal. It would therefore make a test of the March 2 low likely. Since there were 7 consecutive bear days over the past 2 weeks, the odds favor sideways to down trading for at least a few days.
Overnight Emini Globex trading
The Emini is down 29 points in the Globex session. It is therefore in a 2nd leg down from Monday’s strong selloff. Today will open with a big gap down. When there is a big gap, there is an increased chance of a trend day. Furthermore, if there is a trend, it is more likely to be in the direction of the gap (here, down).
Yet, a big gap down means that the Emini will be far below its EMA. Traders do not like to sell when the market is far below its average price. As a result, a big gap down usually results in a sideways 1st hour, even if there is an initial selloff for about 5 bars. In the 1st hour, the Emini typically begins to go sideways to up to the EMA. Once there, the bears will look for a double top or wedge bear flag to sell, hoping for a bear trend and early high of the day.
The bulls prefer an immediate strong reversal up. About 10% of the time, there is a series of big bull bars on the open and the day becomes a strong bull trend day. More often, the best the bulls can get is a trading range for about an hour. If they succeed, they then want a bull breakout above the range, and then a swing up to close the gap.
Yesterday’s setups
Here are several reasonable stop entry setups from yesterday. I sometimes also show limit order entries and entries on the close of bars.
EURUSD pullback from breakout above small bull flag
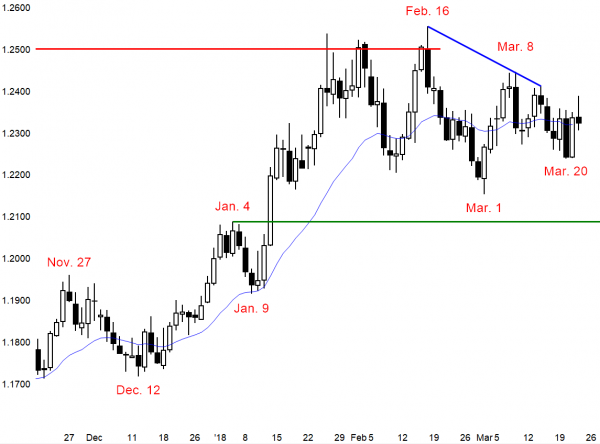
The EURUSD daily Forex chart has been in a tight trading range for 5 days. It is also in the middle of a 3 month range. There is no sign of a breakout up or down.
The EURUSD daily Forex chart is almost completely neutral and in breakout mode. It has been in a tight range for 5 days in the middle of a 3 month trading range. Since the trend before the trading range was up, the bulls are slightly more likely to get an upside breakout. But, their advantage is minimal.
Traders see a bull pattern one day and then an equally hopeful bear pattern a few days later. Until there is a breakout, there is no breakout. It is important to realize that trading ranges can last longer than what traders think is reasonable.
Overnight EURUSD Forex trading
The EURUSD 5 minute Forex chart sold off 80 pips overnight. The bears want the reversal down to continue. However, the bulls see it as a 50% retracement of yesterday’s rally. That rally was from a 3 week wedge bull flag. Therefore, if the bulls can halt the selling at around 1.23 and then get a rally, they would try for a 2nd leg up from the rally that began on March 1.
A Leg 1 = Leg 2 measured move is a reasonable target. That is around the 1.2550 area and the February high. The next couple of days are important. if the bulls can create a couple consecutive big bull days, the odds will favor a test of 1.2550. Since there is a bear trend line on the monthly chart above 1.26, that magnet would be the next target.
The bulls will look for a bull breakout today or tomorrow. If they get it, they will swing part of their position for a test of 1.26.
The bears always want the opposite. They need to end the bull case. A break below the March 20 low would be a break below the 3 week bull flag. That would increase the chance of a test of the March 1 low.
Summary of today’s S&P Emini futures price action and what to expect tomorrow
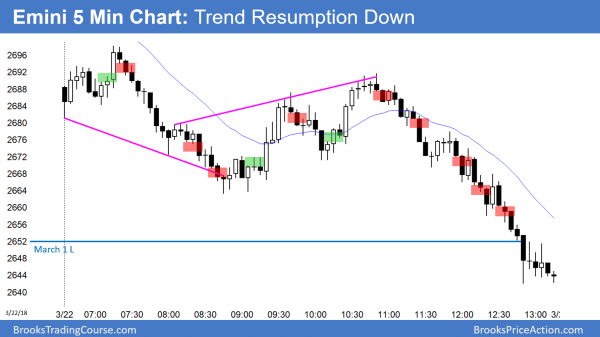
The Emini had a big gap down and then a sell climax that fell below the 2017 close. After a strong rally, it collapsed into the close to below the March low.
After a sell climax to below the 2017 close, the bulls got a strong reversal up. The bears got trend resumption down in the middle of the day. The selloff broke below the March low in a huge sell climax. The bears need follow-through tomorrow to increase their odds of a test of the February low.
Tomorrow is the last day of the week. This week is an entry bar on the weekly chart for a Low 2 sell signal. The bears want this week to be a big bear bar closing on its low. That would increase the odds of follow-through selling next week, and then a test of the February low.
See the weekly update for a discussion of the price action on the weekly candlestick chart and for what to expect going into next week.
Traders can see the end of the day bar-by-bar price action report by signing up for free at BrooksPriceAction.com. I talk about the detailed S&P Emini futures price action real-time throughout the day in the BrooksPriceAction.com trading room. We offer a 2 day free trial.
When I mention time, it is USA Pacific Standard Time (the Emini day session opens at 6:30 am PST, and closes at 1:15 pm PST). You can read background information on the intraday market reports on the Intraday Market Update page.


