Trading Update: Wednesday November 17, 2021
Emini pre-open market analysis
Emini daily chart
- Yesterday was a bull day and it broke above last week’s high. Emini testing November high (November 5).
- Last week was a bear bar on the weekly chart, which is a weak buy signal bar.
- Yesterday closed back below last week’s high and back below the 4700 Big Round Number. It closed just above the midpoint of the day’s range.
- However, I have been saying that the rally is strong enough for traders to expect it to break at least a little above the top of the 15-month bull channel on the weekly chart within the next few weeks.
- There are several ways to draw the channel. The best way has the channel line at 4745 this week, and it will be at 4768 next week.
- Traders should expect at least slightly higher prices, even if the Emini stalls around the November 5 all-time high for a few days.
- The bears want a reversal down from around that November 5 high. That would be a double top on the daily chart.
- But with the bull trend as strong as it has been, traders will buy the 1st 1- to 3-day reversal. The rally should reach the top of the weekly bull channel before traders will consider the possibility of a correction.
Emini 5-minute chart and what to expect today
- Emini is down 4 points in the overnight Globex session.
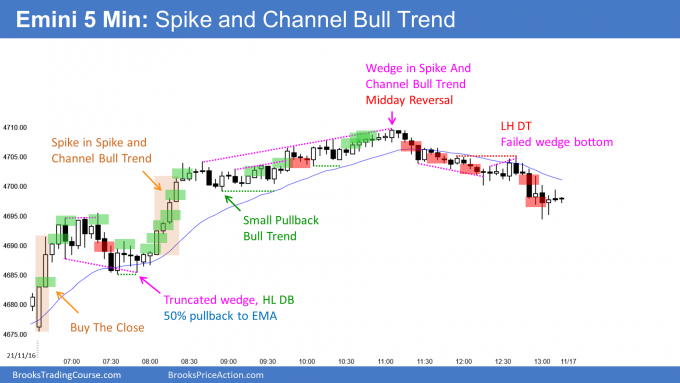
- Yesterday was a Spike and Channel Bull Trend on the 5-minute chart. There is typically a reversal down to the start of the channel and then a conversion into a trading range.
- Yesterday sold off to below the start of the channel. That increases the chance of an early trading range today.
- If today is a bull trend day, it will probably be a weaker type, like a Broad Bull Channel or a Trending Trading Range Day.
- Markets often stall at prior highs. That increases the chance of the Emini being sideways for a couple days.
Yesterday’s Emini setups

Here are several reasonable stop entry setups from yesterday. I show each buy entry with a green rectangle and each sell entry with a red rectangle. Buyers of both the Brooks Trading Course and Encyclopedia of Chart Patterns have access to a much more detailed explanation of the swing trades for each day (see Online Course/BTC Daily Setups).
My goal with these charts is to present an Always In perspective. If a trader was trying to be Always In or nearly Always In a position all day, and he was not currently in the market, these entries would be logical times for him to enter. These therefore are swing entries.
It is important to understand that most swing setups do not lead to swing trades. As soon as traders are disappointed, many exit. Those who exit prefer to get out with a small profit (scalp), but often have to exit with a small loss.
If the risk is too big for your account, you should wait for trades with less risk or trade an alternative market like the Micro Emini.
EURUSD Forex market trading strategies
EURUSD Forex daily chart

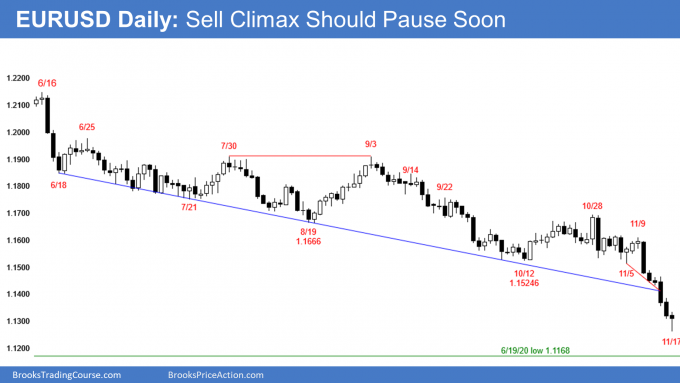
- After 5 strong days down, there should be some minor profit taking soon for a few days.
- Today so far is a reversal day. If today closes above its midpoint, it should lead to a few days of sideways to up trading from bears taking profits and bulls looking for a bounce.
- The selloff has had 3 legs down in a tight bear channel that began in November 5. That is a parabolic wedge sell climax, which typically leads to a bounce with at least a couple legs sideways to up.
- The past 3 days broke far below the bear channel. There is a 75% chance of a reversal back up into the channel starting within 5 days. This should limit the downside over the next few days.
- The EURUSD can get back in the channel by going sideways or up. Because of the parabolic wedge sell climax, it should bounce.
- Can this be the bottom of the bear trend that began in January? It is more likely that the 1st reversal up will be minor. The bulls usually will need at least a double bottom before they can get a bull trend reversal.
- If there is a reversal up, the 1st target is the breakout point, which is the bottom of the bear channel (blue line). Next is the November 5 low at the bottom of the month-long trading range
- Above that is the top of the most recent sell climax, which is the November 9 high.
- If the week closes near the low of the week, this week would be the 2nd consecutive big bear bar on the weekly chart. That would be a strong breakout below last year’s breakout point. The summer rally broke strongly above the March 9, 2020 high. That breakout point should have been support.
- Consecutive big bear bars on the weekly chart closing near their lows would make it likely that the selloff will continue down to the next support, which is the June 19, 2020 low of 1.1168.
- Before this week’s big bear breakout, I said that the bears only had a 30% chance of a break below the bottom of last year’s rally. That is the March 23, 2020 low of 1.0636.
- If this week closes near its low, the bears would have a 40% chance of achieving that goal.
- But that means there is still a 60% chance of a rally from above that low. If there is a rally, it could last a couple months.
- There should be a rally back into the bear channel over the next couple weeks even if there is a brief leg down for a few days first.
Summary of today’s S&P Emini futures price action and what to expect tomorrow

End of day summary
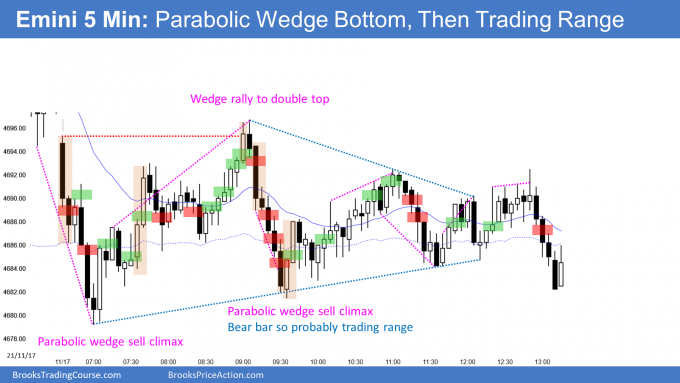
- Bear Trend From The Open, but reversed up from a parabolic wedge not far below the 60-minute EMA.
- The EMAs on the 5- and 60-minute charts were flat and near one another from the end of the first hour. That typically results in a trading range, and it did today.
- Today was a Triangle. There was a minor breakout above the bear trend line, but the day remained sideways and closed below the midpoint.
- The bulls want another new all-time high.
- On the daily chart, today is a High 1 buy signal bar. However, because it had a bear body, it is a weak buy signal bar for tomorrow.
- Today is also a sell signal bar for a double top with the November 5 all-time high. But since it was not a big bear bad closing on its low and the 6-day rally has been strong, it is a weak sell signal bar.
- The Emini has been sideways for 3 days. That increases the chance of more sideways trading tomorrow.
- However, it is testing the all-time high. If there is a series of strong trend bars in either direction in the 1st hour tomorrow, traders will expect a trend day.
See the weekly update for a discussion of the price action on the weekly chart and for what to expect going into next week.
Trading Room
Traders can see the end of the day bar-by-bar price action report by signing up for free at BrooksPriceAction.com. I talk about the detailed S&P Emini futures price action real-time throughout the day in the BrooksPriceAction.com trading room. We offer a 2 day free trial.
Charts use Pacific Time
When I mention time, it is USA Pacific Time. The Emini day session charts begin at 6:30 am PT and end at 1:15 pm PT which is 15 minutes after the NYSE closes. You can read background information on the market reports on the Market Update page.

