Emini stalling at 2500 Big Round Number despite Republican tax reform
Updated 6:42 a.m.
Yesterday was a big range day that opened and closed in the middle. The Emini opened today in the middle of yesterday’s range. The odds are against a big move above or below yesterday’s range. Furthermore, today has an increased chance of being an inside day. That means traders will buy a test of yesterday’s low and sell around yesterday’s high.
Yesterday’s late selloff created a Big Up, Big Down pattern. That usually leads to a trading range. Consequently, there is an increased chance of an early trading range between the 5 and 60 minute moving averages. Then, traders will look for either a breakout up or down. In addition, since today will probably be mostly within yesterday’s range, it will likely be mostly a trading range day. Since yesterday’s legs were big, today will probably have big legs as well.
Pre-Open market analysis
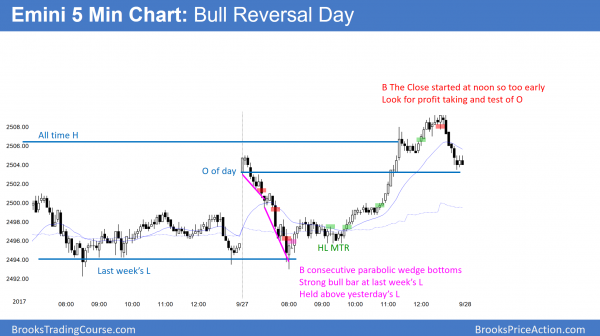
The Emini sold off from a gap up yesterday, but reversed up from consecutive complex bottoms at last week’s low. The reversal up accelerated up to a new all-time high. Because the rally was climactic, the odds favor at least a couple hours of trading range trading today. Furthermore, since the monthly chart is so extremely climactic, the odds are against much higher prices without a 1 – 3 months pullback. The pullback will probably fall 100 – 200 points.
As strong as yesterday’s rally was, it was simply a test of the top of the trading range. The talk about Trump’s tax plan creating a huge bull trend from here is nonsense. The technical fact that the monthly buy climax is extreme is much more important.
Friday is the end of the quarter. As a result, institutions will make changes to their portfolios. That increases the chances of big moves up or down for the rest of the week.
Overnight Emini Globex trading
The Emini is down 5 points in the Globex market, again testing 2500 support. This week had big swings up and down, and that will therefore probably continue today. This is especially true because swings usually are good at the end of a quarter.
While the monthly buy climax could lead to a huge reversal down from yesterday’s rally today, a trading range is more likely. The rally was strong enough to make a bear trend unlikely today. Yet, since the monthly chart is so overbought and the daily chart is at the top of a 3 week range, the odds are against a strong bull trend day.
Yesterday’s setups
Here are several reasonable stop entry setups from yesterday. I sometimes also show limit order entries and entries on the close of bars.
EURUSD Forex market trading strategies
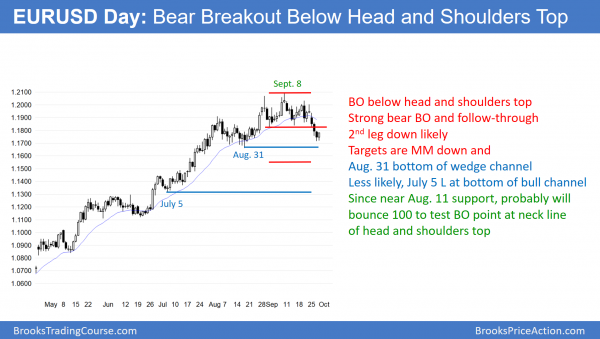
The EURUSD daily Forex chart broke below the neck line of small head and shoulders top. It is now bouncing about 100 pips to test the breakout point.
I said yesterday that the daily chart would probably bounce 100 pips. This is because a break below the neck line of the head and shoulders top typically test the breakout point. Here, in addition, the bulls are trying to create a higher low in their bull trend.
Since the August 17 low is major, the bulls do not not any reversal to fall below it. A bull trend needs a series of major higher lows. Once a minor reversal falls below the most recent one, then the trend has evolved into either a trading range or a bear trend.
Bull trend evolving into a trading range
Because the weekly bull trend is so strong, the daily chart is probably evolving into a trading range and not a bear trend. Yet, traders do not yet know if the bottom of the trading range is around the August 17 low or down at the next support. That is around 1.1600, at the top of the 2 year trading range.
The daily chart has already been in a trading range for 2 months. The bulls want a double bottom with the August 17 low. They then want a strong reversal up, hoping the bull trend will resume. The 3 day break below the head and shoulders top was strong enough to make at least one more leg down likely. Therefore, the odds are that the best the bulls can get over the next week is a lower high.
Yet, the rally will probably go above the September 14 low. This is because the chart is still in a trading range. When in a range, legs up and down disappoint bulls and bears. By going above resistance, the bears would be disappointed. Yet, the odds are the bulls would then be disappointed by their inability to rally much higher. Consequently, the rally will probably form a lower high and lead to a break below the August 17 major higher low.
Overnight EURUSD Forex trading
The 5 minute chart rallied 60 pips overnight. While there might be one more brief selloff below yesterday’s low in the next few days, the odds favor a move above the 1.1837 September 14 low over the next week. Consequently, the bulls will buy selloffs. Yet, the rally will probably fail and form a lower high. In addition, the month long selloff will probably fall below the August 17 low of 1.1661 within a couple of weeks. As a result, bears will sell rallies.
Summary of today’s S&P Emini futures price action and what to expect tomorrow
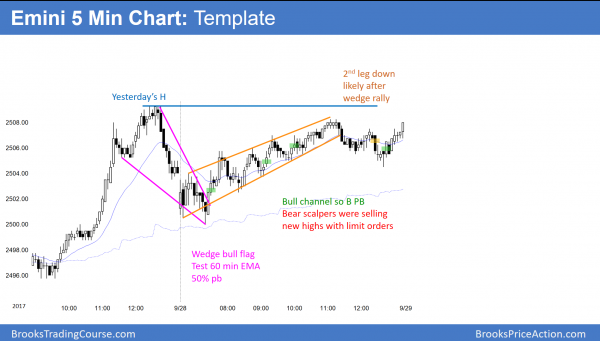
The Emini rallied from a wedge bull flag. The rally was a weak wedge bull channel. The bears got 2 legs down later in the day.
Today was a weak rally after yesterday’s strong rally. The odds are that today was a bull leg in a trading range that began with yesterday’s late selloff. The odds are that it will lead to a test back down early next week.
While today is a bull inside bar on the daily chart, it is a weak buy setup. This is because the monthly chart is so extremely overbought. Hence, the upside is small without 1st a 100 point pullback.
See the weekly update for a discussion of the price action on the weekly candlestick chart and for what to expect going into next week.
Traders can see the end of the day bar-by-bar price action report by signing up for free at BrooksPriceAction.com. I talk about the detailed S&P Emini futures price action real-time throughout the day in the BrooksPriceAction.com trading room. We offer a 2 day free trial.
When I mention time, it is USA Pacific Standard Time (the Emini day session opens at 6:30 am PST, and closes at 1:15 pm PST). You can read background information on the intraday market reports on the Intraday Market Update page.


