Trading Update: Thursday January 27, 2022
Emini pre-open market analysis
Emini daily chart
- The bulls want a reversal from the 200-day moving average after the spike and parabolic sell climax.
- The market has a wedge top on the daily chart, with the third push-up being December 28. The selloff to January 24 may be the first push down, which means traders will expect a 2nd leg down after any bounce. It is possible the second led down would start after a test of the December 2021 lows.
- It is important to note that a second leg down from the Wedge top does not have to fall far below the January 24 low. If the market has a deep pullback, that 2nd leg down may test the January 24 low and not fall far below.
- The bears failed to break strongly below the October low on Monday, and the day set up a strong buy signal for the bulls, which triggered yesterday.
- The bears see a low 1 with yesterday’s low; however, the bar has a big tail below, and it follows three sideways bars, which increases the odds of a failed low 1 and more sideways.
- If the market does fall below the low 1 short, the odds are more likely to be more buyers at yesterday’s low than sellers.
- The market is not likely to go far below the October low within the next couple of weeks.
- The daily chart is clearly in a trading range, which means traders should expect the bears to be disappointed soon and likely a rally that will go further than what the bears want to see.
- The December 2021 lows are an obvious magnet. This is because bulls were willing to buy the December low and lower, and those bulls will be more than happy to sell out of their longs back at the December lows (4485.25).
- The open of the week (4326.25) is an important magnet. The bears had a strong close on the weekly chart. The bears want to close below the open this week so that traders will see the current week as follow-through. The bulls want to create as big of a bull bar as possible, which means closing as far above the open of the week as they can.
- If the bulls can close the week around Monday’s high, that will increase the odds of a rally over the next 1-3 weeks.
- Overall, traders should expect the market to begin to go more sideways over the next couple of weeks.
Emini 5-minute chart and what to expect today
- Emini is up 40 points in the overnight Globex session. The will gap up on the open.
- Over the past couple of days, the market has been sideways, so traders may expect price to test up on the open and test up to yesterday’s 7:50 low (bottom of a trading range before FOMC breakout). UPDATE: the market is currently only 7 points away from this target.
- The bulls are hopeful that they can create as big a bull day as possible, increasing the chances that Friday will close far from the open of the week.
- Since today will gap up, traders will look for gap patterns. I have listed a few possible swing setups that may happen today:
- A pullback to the moving average that forms a double bottom or a wedge bottom
- A double top or wedge top setting up a reversal pattern.
- While most traders would like a pullback to the moving average on the open, traders have to be open to the opposite such as a bull trend from the open or a possible small pullback bull trend day.
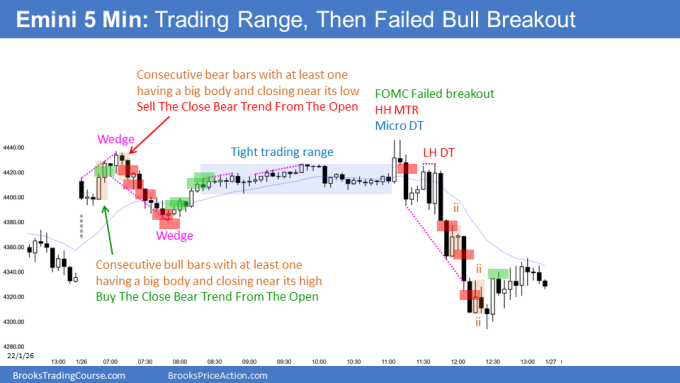
Yesterday’s Emini setups

Al created the SP500 Emini charts.
Here are several reasonable stop entry setups from yesterday. I show each buy entry with a green rectangle and each sell entry with a red rectangle. Buyers of both the Brooks Trading Course and Encyclopedia of Chart Patterns have access to a much more detailed explanation of the swing trades for each day (see Online Course/BTC Daily Setups).
My goal with these charts is to present an Always In perspective. If a trader was trying to be Always In or nearly Always In a position all day, and he was not currently in the market, these entries would be logical times for him to enter. These therefore are swing entries.
It is important to understand that most swing setups do not lead to swing trades. As soon as traders are disappointed, many exit. Those who exit prefer to get out with a small profit (scalp), but often have to exit with a small loss.
If the risk is too big for your account, you should wait for trades with less risk or trade an alternative market like the Micro Emini.
EURUSD Forex market trading strategies
EURUSD Forex daily chart

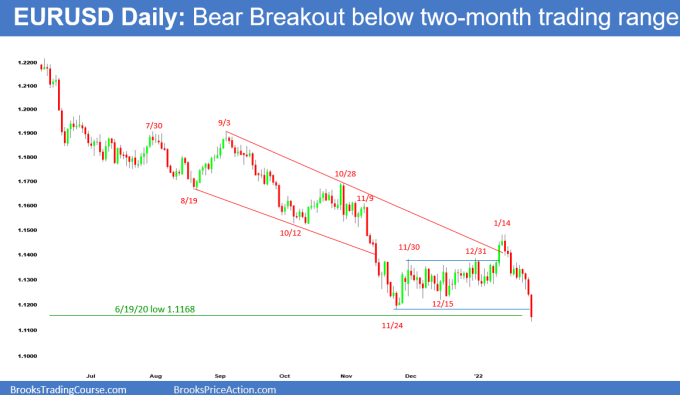
- The bears have been drifting down in a tight bear channel since the failed bull breakout on January 12.
- The bears managed to get a bear breakout yesterday, closing below the close of the past 27 days.
- During the overnight session, the bears managed to sell off over 80 pips, breaking below the 2-month trading range and the start of the June 19, 2020, bull channel (1.1168).
- As of this moment, the bear breakout over the past two days is strong enough so that traders will expect at least a 2nd leg down.
- The bears are hopeful that they get a measured move down of the 2-month trading range of around 200 pips; however, it is more likely that the bears will be disappointed soon, and traders will view this bear breakout as a break below a final flag.
- So far, today is becoming the biggest bear bar since the bear trend started back in June 2021. A big bear bar late in a trend is usually a sign of exhaustion and an end to the sale of soon.
- The risk the bulls face is that today’s big bear bar is breaking below an obvious trading range which increases the chances that this is the start of a breakout that could fall much further than what traders want.
- Traders need to see how today closes. At this moment, I expect today to look disappointing for the bears. One reason for that is that currently, the bar is over 100 pips tall going into the US session. The bears will have to keep the price down here for the remainder of the US session, which I do not think is likely. Also, we are at obvious support levels.
- Traders will look for a trend reversal setup, such as a major trend reversal or trend resumption pattern at some point in the day.
Summary of today’s S&P Emini futures price action and what to expect tomorrow

End of day summary
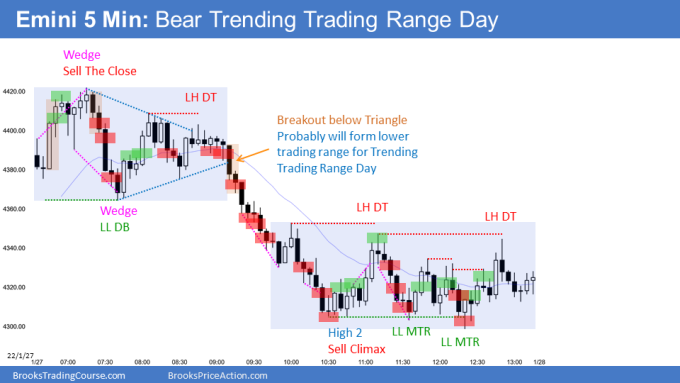
- Today opened with a Gap up that formed a parabolic wedge top.
- The opening rally looked like a leg in what would become a trading range day, and the price was far from the moving average. Traders typically do not want to buy far away from the average price. When the parabolic wedge formed on bar 10, traders became more confident that the market would likely test down for two legs and reach the moving average.
- The market formed a parabolic wedge bottom and a double bottom with bar 2, so traders would likely expect a bounce for a few legs.
- Within two and a half hours into the day, it was clear the market was forming a triangle. Traders expected breakout mode and a breakout up or down, followed by a measured move.
- By 9:20, it was always in short and sell the close for at least a few legs down.
- While a swing down was likely at 9:20, price would probably stall around the lows of the previous day, and traders had to be open to a possible trending trading range day.
- By 10:25, the market has had consecutive sell climaxes, a measured move down based on opening range, and was near the previous day’s low. Most bears will be quick to take profits expecting the market to go sideways soon, which it did for the rest of the day.
- The bulls bought around 10:25, expecting a few legs up and a trading range. The bulls tried to get a successful major trend reversal attempt and failed, causing the market to go sideways for the rest of the day.
See the weekly update for a discussion of the price action on the weekly chart and for what to expect going into next week.
Trading Room
Traders can see the end of the day bar-by-bar price action report by signing up for free at BrooksPriceAction.com. I talk about the detailed S&P Emini futures price action real-time throughout the day in the BrooksPriceAction.com on trading room days. We offer a 2 day free trial.
Charts use Pacific Time
When I mention time, it is USA Pacific Time. The Emini day session charts begin at 6:30 am PT and end at 1:15 pm PT which is 15 minutes after the NYSE closes. You can read background information on the market reports on the Market Update page.

