Emini reacts to government shutdown vote
Updated 6:44 a.m.
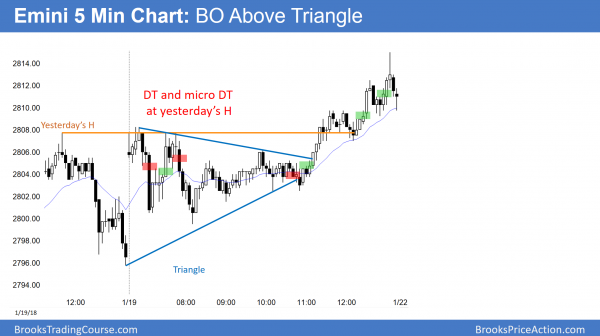
The Emini opened with a small double bottom bull flag. Since there is a 5 minute wedge top nested within a 60 minute wedge top, the odds are against a big bull trend day. In addition, Friday’s rally was weak. This adds to the likelihood that today will begin to pull back after the nested wedge top.
The bulls want a breakout and measured move up. However, there is better than a 50% chance that a breakout above the wedge will fail and reverse down. The bears will be satisfied by any selloff for a day or two, whether or not it is strong. Unless there is a strong break above the 60 minute wedge top today, the odds favor a 2 – 3 sideways to down days this week.
Today’s open is forming a trading range with Friday’s closing range. This is probably a trading range open, which means that the Emini might go mostly sideways for an hour or more before deciding on the direction of the 1st swing. Since Thursday and Friday were mostly sideways and the Emini has not yet strongly broken out of that range, the odds are that today will be mostly sideways as well.
Pre-Open market analysis
Congress shut the government down over the weekend, but the Emini is unchanged this morning. Friday broke above Thursday’s high. Since Thursday was a bear bar on the daily chart, it was a weak buy signal bar. That means that there are typically more sellers than buyers above its high. However, the bull trend is extremely strong and that is more important.
The weekly chart last week was a bull doji and it followed 2 big bull trend bars. It is weak follow-through buying, but a bad sell signal bar. Until there are consecutive big bear bars on the daily chart, the odds continue to favor higher prices.
Overnight Emini Globex trading
The Emini is down 1 point in the Globex market. Friday ended with a wedge top and a small leg down on the 5 minute chart. The odds are that there will be at least a small 2nd leg down today that tests the bottom of the wedge, which is around 2807.
The 60 minute chart also has a wedge rally. The bottom of the wedge is 2769.25, which is last week’s low. Since a wedge is a channel and channels usually evolve into trading ranges, the odds favor a reversal down on the 60 minute chart this week. Consequently, there is an increased chance of a bear trend day today or tomorrow.
However, the buy climaxes on the daily, weekly, and monthly charts have been stronger than any in the history of the stock market. Therefore, there is a 50% chance of a breakout above the wedge and then a measured move up to around 2860 over the next 2 weeks.
Friday’s setups
Here are several reasonable stop entry setups from Friday. I sometimes also show limit order entries and entries on the close of bars.
EURUSD Forex market bull flag at resistance
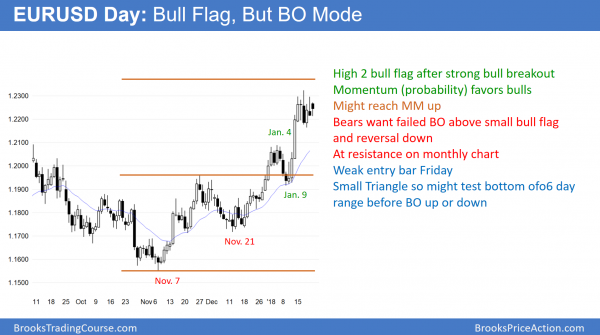
The EURUSD daily Forex chart is in a bull flag. Since the momentum up was strong 2 weeks ago, the probability favors a bull breakout. Yet, the monthly chart (not shown) is testing the resistance of the bottom of a 10 year trading range and it might form a wedge top this month.
The EURUSD daily Forex chart has been in a tight trading range for 6 days. Because the trend before it was up, the odds favor a bull breakout. Yet, this yearlong rally is now testing the bottom of a 10 year trading range. In addition, the rally since the May 2016 high is a wedge. Consequently, if the bears get a strong reversal down in February or March, the daily chart will probably trade sideways to down for several months.
The bulls need a strong breakout above 1.2500. If they get it, the rally would then probably continue up to the 1.4000 area over the next 2 years, which is a major lower high on the monthly chart. A reversal down and a trading range is more likely over the next 6 months. This is because the rally is a wedge, and it is a 50% pullback of the 2014 selloff. Finally, it is testing the resistance at the bottom of a 10 year trading range.
Overnight EURUSD Forex trading
The 5 minute chart has been in a 200 pip trading range for 6 days. In addition, it is forming lower highs and higher lows. This is therefore a triangle. The legs overnight were about 60 pips tall. Day traders will scalp today, unless there is a strong breakout up or down.
When there is a triangle, there is a 50% chance that the 1st breakout will fail. Furthermore, once there is a successful breakout, there is a 50% chance that it will be either up or down.
Summary of today’s S&P Emini futures price action and what to expect tomorrow
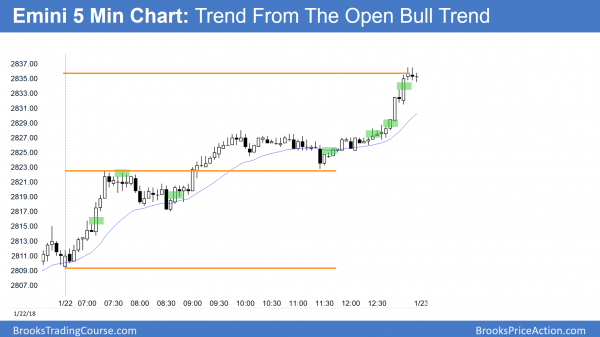
Today was a Trend From The Open bull trend day. It was also a Trending Trading Range day. There was a breakout below the upper range, but it reversed back up at 1 tick above the top of the lower range. It ended with a Buy The Close rally and a measured move up.
Today was another strong bull trend day. It broke above the 60 minute wedge top. Despite the extreme buy climaxes on the higher time frames, there is no sign of a top. The odds, therefore, continue to favor at least slightly higher prices.
See the weekly update for a discussion of the price action on the weekly candlestick chart and for what to expect going into next week.
Traders can see the end of the day bar-by-bar price action report by signing up for free at BrooksPriceAction.com. I talk about the detailed S&P Emini futures price action real-time throughout the day in the BrooksPriceAction.com trading room. We offer a 2 day free trial.
When I mention time, it is USA Pacific Standard Time (the Emini day session opens at 6:30 am PST, and closes at 1:15 pm PST). You can read background information on the intraday market reports on the Intraday Market Update page.


