Trading Update: Friday August 12, 2022
Emini pre-open market analysis
Emini daily chart
- Emini possibly sideways trading range soon.
- The market broke above the midpoint of the year (4,220) and closed near its low yesterday.
- While the market is in a small pullback bull trend, the odds favor the market forming a trading range soon and the tight channel going sideways.
- The bears see the July 29 – August 9 as a final flag and August 11 as the reversal up from the final flag. The bears expect the market to test back to the midpoint of the trading range (4,130), which it probably will.
- The channel up is tight, so most bears would like to see some kind of micro double top at a minimum before looking to short.
- The bulls have an open gap (July 22 high and August 2 low); they hope this gap will lead to a measured move of the July 14 low to the midpoint of the above gap, projecting up to around 4,400.
- While, at the moment, the market will probably pull back and test the above gap before it reaches 4,400, traders have to respect the tight channel up, as it can go a long way before reversing.
- Today is Friday, so weekly support and resistance are important.
- Currently, the weekly chart is at the midpoint of the week. The bulls will try their best to keep the market above the midpoint, and the bears will do their best to close the market below the midpoint.
- Overall, the bears want today to be a strong entry bar following yesterday’s bear bar closing near its low. The bulls want the opposite and will try to prevent any strong entry bar from forming today.
Emini 5-minute chart and what to expect today
- Emini is up 15 points in the overnight Globex session.
- The market has had a bull rally in a likely leg of a trading range during the Globex overnight session.
- Traders should expect a trading range open that will have multiple reversals.
- Most traders should consider waiting for 6-12 bars before placing any trades.
- Traders can also consider waiting for a credible setup such as a double top/bottom, wedge top/bottom, or a credible breakout with follow-through.
- Since the open is likely to have a lot of trading range price action, traders should be careful about betting on breakouts.
- If there is going to be a strong breakout, there will be plenty of time to enter in the direction of the breakout.
- Since today is Friday, there is an increased risk of a surprise move late in the day as institutions decide on the weekly chart close.
Yesterday’s Emini setups

Al created the SP500 Emini charts.
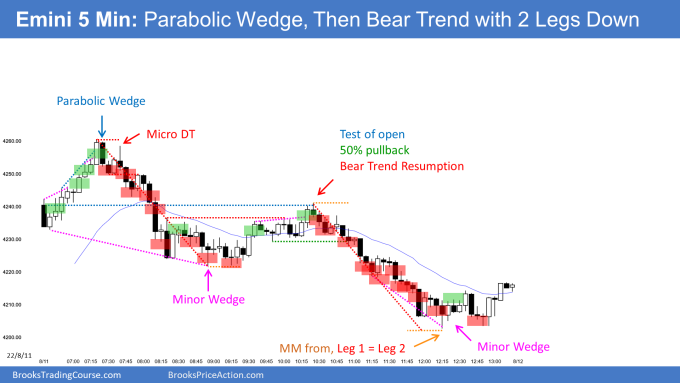
Here are several reasonable stop entry setups from yesterday. I show each buy entry with a green rectangle and each sell entry with a red rectangle. Buyers of both the Brooks Trading Course and Encyclopedia of Chart Patterns have access to a much more detailed explanation of the swing trades for each day (see Online Course/BTC Daily Setups).
My goal with these charts is to present an Always In perspective. If a trader was trying to be Always In or nearly Always In a position all day, and he was not currently in the market, these entries would be logical times for him to enter. These therefore are swing entries.
It is important to understand that most swing setups do not lead to swing trades. As soon as traders are disappointed, many exit. Those who exit prefer to get out with a small profit (scalp), but often have to exit with a small loss.
If the risk is too big for your account, you should wait for trades with less risk or trade an alternative market like the Micro Emini.
EURUSD Forex market trading strategies
EURUSD Forex daily chart

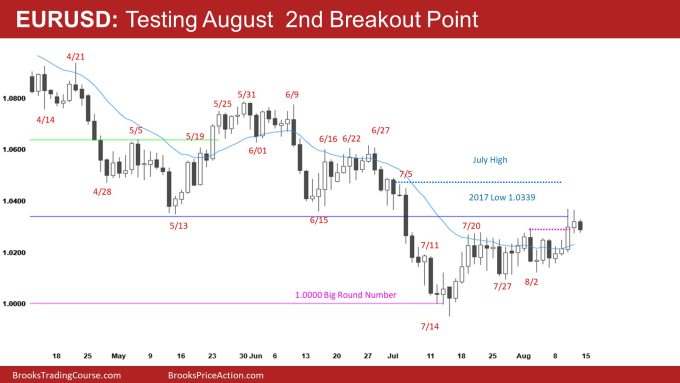
- The market is pulling back and testing the August 2 breakout point of the tight trading range.
- The bulls see the current bear bar as a pullback from the breakout that happened two days ago.
- Bears see today as the reversal attempt of the upside breakout of August 2.
- The bears also see the current bear bar as a large two-legged pullback.
- Bulls are taking profits back at the 2017 low, and bears sold for a scalp.
- Overall, the market will likely continue sideways to up and test the bottom of the May – June trading range.
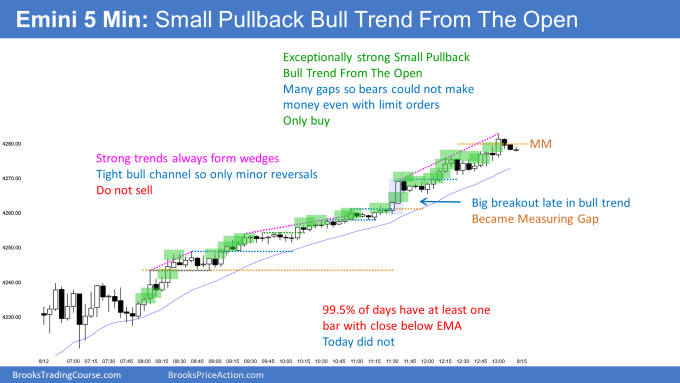
Summary of today’s S&P Emini futures price action and what to expect tomorrow

Al created the SP500 Emini charts.
End of day video review
See the weekly update for a discussion of the price action on the weekly chart and for what to expect going into next week.
Trading Room
Traders can see the end of the day bar-by-bar price action report by signing up for free at BrooksPriceAction.com. Al talks about the detailed S&P Emini futures price action real-time throughout the day in the BrooksPriceAction.com on trading room days. We offer a 2 day free trial.
Charts use Pacific Time
When times are mentioned, it is USA Pacific Time. The Emini day session charts begin at 6:30 am PT and end at 1:15 pm PT which is 15 minutes after the NYSE closes. You can read background information on the market reports on the Market Update page.

