Trading Update: Friday November 5, 2021
Emini pre-open market analysis
Emini daily chart
- Extremely strong bull trend. Will gap up today.
- Parabolic wedge buy climax that is testing top of tight bull channel at 4693 created by October 7 and September 2 highs.
- Next targets are 4700 Big Round Number and top of channel created by May 7 and September highs, which is at 4713 today.
- Above that is the measured move target at 4802.00, based on the height of the summer trading range.
- After 3 bull days opening near their lows and closing near their highs, traders might begin to take some profits today or Monday.
- While there is a parabolic wedge buy climax on the daily chart, the bears typically will need a micro double top before they can get more than a 3-day pullback. They do not even have a bear bar yet.
- If today reverses down, the reversal will probably only last 1 to 3 days.
- There is a seasonal tendency to pull back in the 2nd week of November, but there is a strong tendency to rally from November 11 to December 5.
- I do not trade seasonal tendencies because it is very difficult to construct a profitable strategy using them. However, they are factors to consider. Traders looking for a big selloff in a bull trend during a seasonally bullish time need very strong bear bars before shorting.
- Today is Friday and therefore weekly support and resistance can be important, especially in the final hour.
- So far, the week is a bull bar closing near its high. The tops of the 2 channels and the 4700 Big Round Number are magnets for the bulls.
- For the bears, the low of the week is probably too far below for it to be a magnet today.
- As an alternative, the bears will try to get the week to close below the middle of the week’s range. That would increase the chance that next week would be sideways instead of up.
- The closer to the high of the week that the week closes, the more likely next week will trade higher.
Emini 5-minute chart and what to expect today
- Emini is up 20 points in the overnight Globex session. It will gap up.
- It is at the top of the tight bull channel in a parabolic wedge buy climax, but there is no top yet and there are other magnets above (4700 Big Round Number and 4713 top of bull channel on daily and weekly charts).
- Big gap increases chance of trend day. If there is a trend, it is slightly more likely to be in the direction of the gap (here, up).
- Can it break far above 4713 at the top of the channel? The bull trend is extremely strong. If the market is forming consecutive bull bars closing near their highs, traders will buy and not worry about resistance.
- Because the daily chart is so overbought and in a resistance area, a big bear trend can come at any time.
- The bears will need a couple big bear bars closing near their lows before looking for lower prices. Or, if there is a big bear bar on the open closing near its low, that would be a sell signal for a possible Bear Trend From The Open.
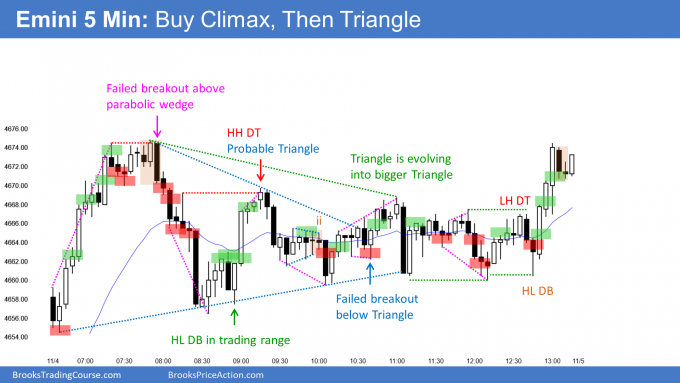
Yesterday’s Emini setups

Here are several reasonable stop entry setups from yesterday. I show each buy entry with a green rectangle and each sell entry with a red rectangle. Buyers of both the Brooks Trading Course and Encyclopedia of Chart Patterns have access to a much more detailed explanation of the swing trades for each day (see Online Course/BTC Daily Setups).
My goal with these charts is to present an Always In perspective. If a trader was trying to be Always In or nearly Always In a position all day, and he was not currently in the market, these entries would be logical times for him to enter. These therefore are swing entries.
It is important to understand that most swing setups do not lead to swing trades. As soon as traders are disappointed, many exit. Those who exit prefer to get out with a small profit (scalp), but often have to exit with a small loss.
If the risk is too big for your account, you should wait for trades with less risk or trade an alternative market like the Micro Emini.
EURUSD Forex market trading strategies
EURUSD Forex daily chart

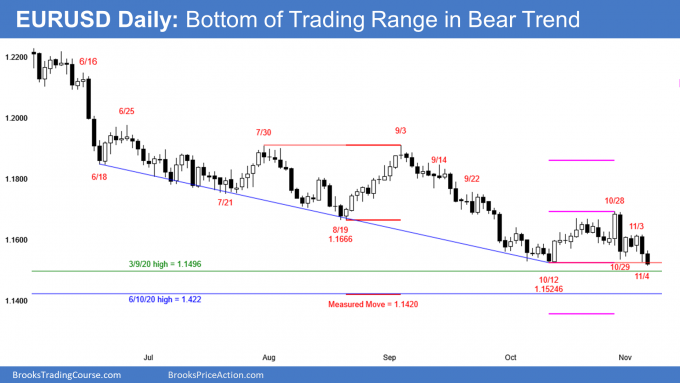
- Yesterday was a big bear day and it traded below the October 29 sell climax low. It therefore met the minimum expectation of the bears who were looking for a 2nd leg down.
- In the minutes after today’s unemployment report, today broke below the October 12 bottom of the month-long trading range.
- The bulls are still hoping for a reversal up from a lower low double bottom. They want a measured move above the October 28 neckline, which would be a test of the January 3 high.
- They need a bull bar closing near its high within the next few days to convince traders that a double bottom reversal is underway.
- Without that, the odds still favor a test below the March 9, 2020 high. That was the breakout point for last summer’s strong rally. Since the EURUSD has been in a trading range for 7 years, traders should expect it to go beyond support or resistance before reversing because that is what typically happens.
- If there is a strong reversal up within the next week, traders will expect a move up to the October 28 high and maybe the September 3 high without first dropping below the March 9, 2020 high.
- Whether or not the selloff continues down to below the March 9, 2020 high or the lower breakout point of the June 10, 2020 high, traders should expect a reversal up lasting several weeks before the EURUSD falls much below that support. Trading ranges have reversals and breakouts tend to fail.
- It is possible that the rally might not come until January 1. Currency markets have an increased chance of making reversals at the start of a year.
- The selloff from the weekly head and shoulders top currently has only a 30% chance of continuing down for a measured move to last year’s low at around 1.06.
Summary of today’s S&P Emini futures price action and what to expect tomorrow

End of day summary
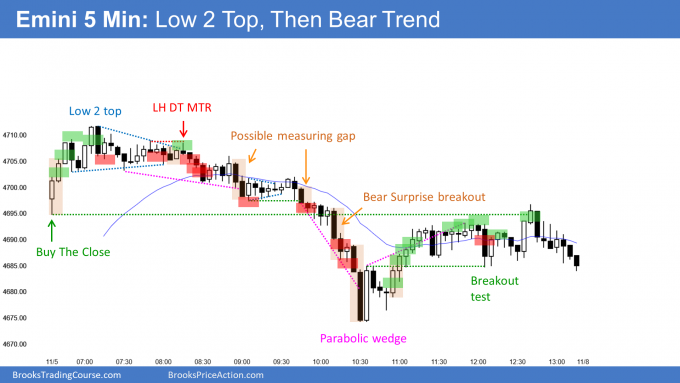
- Rally on open, but far above EMA and therefore unlikely to continue for long.
- Low 2 top and then double top lower high major trend reversal.
- Weak bear channel, but then bear breakout and acceleration down.
- Parabolic wedge sell climax and strong reversal up.
- Today was bear bar on daily chart, but big tail below so weak sell signal bar.
- Daily chart has parabolic wedge buy climax at top of bull channel so today might be start of 1- to 3-day pullback.
See the weekly update for a discussion of the price action on the weekly chart and for what to expect going into next week.
Trading Room
Traders can see the end of the day bar-by-bar price action report by signing up for free at BrooksPriceAction.com. I talk about the detailed S&P Emini futures price action real-time throughout the day in the BrooksPriceAction.com trading room. We offer a 2 day free trial.
Charts use Pacific Time
When I mention time, it is USA Pacific Time. The Emini day session charts begin at 6:30 am PT and end at 1:15 pm PT which is 15 minutes after the NYSE closes. You can read background information on the market reports on the Market Update page.

