Trading Update: Friday February 11, 2022
Emini pre-open market analysis
Emini daily chart
- An Emini micro double top formed over the past 2 days and a double top with the February 2 high.
- The Emini has been reversing up from a sell climax for 2 weeks. Yesterday rallied on the open, but then sold off to a new low after again testing the February 2 high.
- While it closed near its low, it is still within an 8-day tight trading range. That means it is in Breakout Mode.
- The bulls need a strong breakout above that February 2 high before traders will be confident that the January 4 bottom will hold.
- I said last week that the Emini would test the February 2 high, which it did Wednesday and again yesterday.
- I also said that the January selloff was so strong that the rally should form a lower high and then test the January low.
- If the Emini reverses down from here, there will be a double top with the February 2 high.
- If it breaks above that high and then reverses down, there will be a wedge top where January 26 was the 1st top and February 2 was the 2nd top.
- A reversal down would also be a lower high major trend reversal and the right shoulder of a head and shoulders top (the November 5 high as the left shoulder).
- It is still more likely that the strong rally over the past 2 weeks will reverse down before breaking to a new high. The Emini has been in a trading range for 7 months and strong legs up and down are more likely to reverse than lead to a trend.
- Also, there are back to back OO patterns on the monthly chart. They are consecutive attempts to reverse the strong bull trend from the pandemic low. A 2nd attempt has a higher probability of success.
- At a minimum, traders should expect a break below the January low before a break above the January high. That would trigger the OO sell signal on the monthly chart. I have been saying that the selloff would probably last 2 to 3 months.
- There is currently a 50% chance that the Emini will test the 4,000 Big Round Number before making a new high.
- There is only a 30% chance that a selloff will reach the pre-pandemic high.
- But even if it does, there will still likely be at least one more new high before the monthly chart could selloff for more than a few months.
Emini 5-minute chart and what to expect today
- Emini is up 4 points in the overnight Globex session.
- Yesterday was a sell climax day. There is a 50% chance of some follow-through selling in the 1st hour.
- There is also a 75% chance of at least a couple hours of sideways to up trading that starts by the end of the 2nd hour.
- Today is Friday so weekly support and resistance can be important, especially in the final hour.
- The week closed near the open of the week. This week so far is a small doji bar on the weekly chart in the middle of last week’s range.
- Other nearby magnets are the December low, the open of the month and the December 20 low.
- If this week is a big bear bar on the weekly chart, next week will probably be lower.
- If this week closes on the high of the week, next week will probably be higher.
- If it closes around where it is, the week will be more neutral. That would increase the chance of more sideways trading next week.
Yesterday’s Emini setups


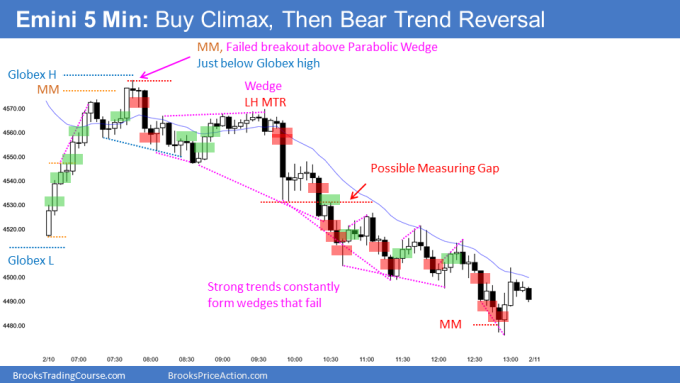
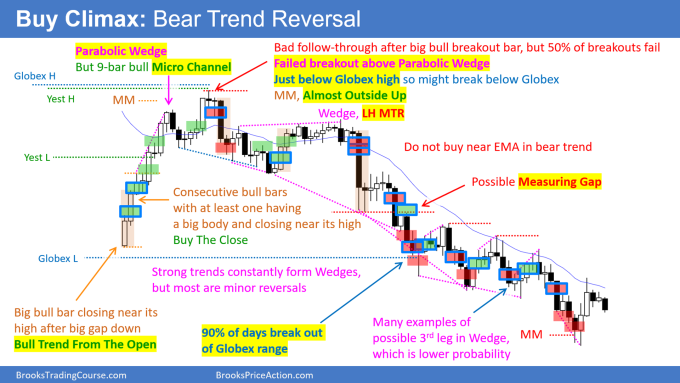
Here are several reasonable stop entry setups from yesterday. I show each buy entry with a green rectangle and each sell entry with a red rectangle. Buyers of both the Brooks Trading Course and Encyclopedia of Chart Patterns have access to a much more detailed explanation of the swing trades for each day (see Online Course/BTC Daily Setups).
My goal with these charts is to present an Always In perspective. If a trader was trying to be Always In or nearly Always In a position all day, and he was not currently in the market, these entries would be logical times for him to enter. These therefore are swing entries.
It is important to understand that most swing setups do not lead to swing trades. As soon as traders are disappointed, many exit. Those who exit prefer to get out with a small profit (scalp), but often have to exit with a small loss.
If the risk is too big for your account, you should wait for trades with less risk or trade an alternative market like the Micro Emini.
EURUSD Forex market trading strategies
EURUSD Forex daily chart

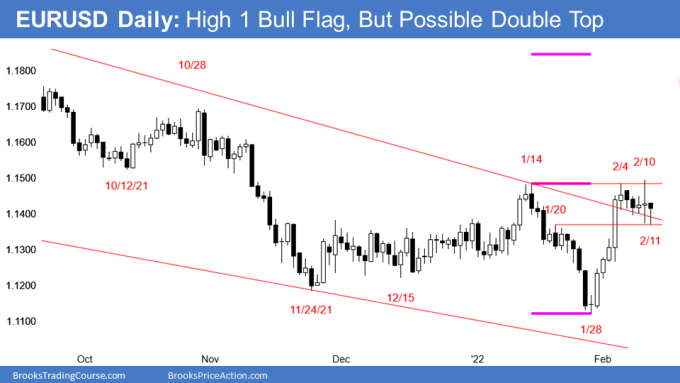
- The EURUSD broke above the January 14/February 4 double top yesterday, but closed below it and just above the open. It was a big doji bar and there is now a 5-day tight trading range.
- This is not yet a successful breakout. The bulls need a couple bull bars closing near their highs and above the double top before traders will look for a measured move up from the 3-month trading range.
- With the lack of buying over the past 6 days, many bulls might want a lower test before they become confident that the yearlong selloff has ended.
- The bears want a reversal down from the double top to below the January low. Additionally, they want a breakout below that low and then a 300-pip measured move down to around the bottom of the 8-year trading range.
- I have been saying that a break below the 3-month trading range was likely to fail and that the reversal up should last at least a couple months. This is still true.
- However, if Russia invades the Ukraine and Europe handles it poorly, the EURUSD could test the bottom of the 8-year range.
Summary of today’s S&P Emini futures price action and what to expect tomorrow

End of day summary
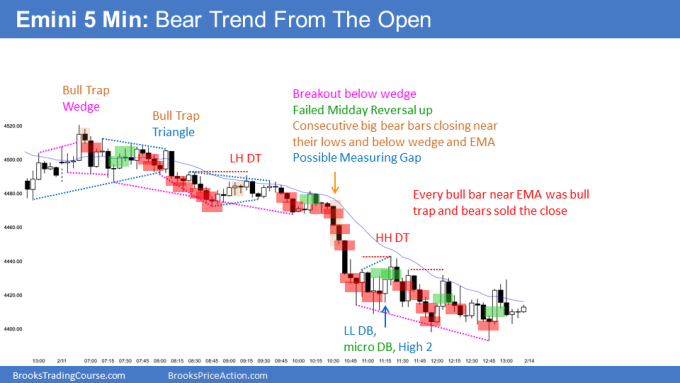
- The Emini broke strongly to the upside on the open, but bears sold the rally. It was a failed breakout above the EMA and a bull trap.
- The Emini was sideways for 19 bars in a triangle, but could not break strongly above the EMA. The EMA was resistance all day.
- The Emini was in a bear channel for the 1st half the day.
- After the big, midday bear breakout, the Emini resumed its bear channel, again reversing down from every big bull bar closing near the EMA.
- Today was the 2nd consecutive strong bear trend day, which is unusual. There is a 75% chance of at least a couple hours of sideways to up trading on Monday.
- But if Russia invades this weekend, and especially if Europe has a weak response, the Emini will quickly drop to below 4000.
- I have been saying that it should break below the January low before it breaks above the January high. This is still true.
- Today broke below the 8-day trading range. Therefore, Monday is the follow-through bar.
- If it is a bull bar closing near its high, traders will expect today’s bear breakout to fail.
- If it is another bear bar, especially if it is big and closes near its low, traders will look for a measured move down below the 8-day trading range. That would be a test of the January 28 low and the January low.
See the weekly update for a discussion of the price action on the weekly chart and for what to expect going into next week.
Trading Room
Traders can see the end of the day bar-by-bar price action report by signing up for free at BrooksPriceAction.com. I talk about the detailed S&P Emini futures price action real-time throughout the day in the BrooksPriceAction.com on trading room days. We offer a 2 day free trial.
Charts use Pacific Time
When I mention time, it is USA Pacific Time. The Emini day session charts begin at 6:30 am PT and end at 1:15 pm PT which is 15 minutes after the NYSE closes. You can read background information on the market reports on the Market Update page.

