Trading Update: Tuesday April 11, 2023
S&P Emini pre-open market analysis
Emini daily chart
- The Bulls got a strong bull bar closing on its high yesterday. The bulls want yesterday to be a micro double bottom that will lead to a rally above the April 4th high.
- Since the market is in a Trading Range, Emini likely to disappoint bulls soon.
- While the market is Always In Long and will likely go higher, it is within a large trading range. The market is beginning to stall under an important resistance level above the February 2nd high.
- When the market stalls just under an important resistance level, it is a sign that the market is in a trading range and the momentum is not as strong as it could be.
- If the bulls were strong, they would not allow the market to stall under the February 2nd high. Instead, the bulls would break far above the February 2nd high. This means traders are selling before the market reaches February 2nd because they are less confident that the market will reach the February 2nd high before a deep pullback.
- The next important magnet is the March 22nd breakout point high.
- The bulls want to trap the bears and prevent the market from reaching the March 22nd high. There are bears that sold this high and scaled in higher. These bears are holding a losing position and deciding what to do.
- If the market continues to go sideways and build selling pressure, the probability will increase that the market will get below the March 22nd high and allow the bears out.
- The bears ultimately want to test back down to the March 13th low. Trading ranges often have deep pullbacks. This means traders should be prepared for a possible lower high below the February 2nd high and a test back down to the March 13th low.
- Overall, the bears have not created enough selling pressure to convince traders that the bulls have lost control. This means that sideways to up is likely over the next few days.
Emini 5-minute chart and what to expect today
- Emini is up 1 point in the overnight Globex session.
- The market failed to break out above yesterday’s range during the early morning Globex hours.
- The bears recently got a downside breakout and want the market to have a second leg down.
- Traders should be neutral going into the U.S. Session open.
- As I often say, most traders should wait for 6 – 12 bars before placing a trade unless they are comfortable with limit orders and making quick decisions.
- Most traders should focus on catching the opening swing that often forms before the end of the second hour after forming a double top/bottom or a wedge top/bottom.
- Traders can wait for a strong breakout with follow-through closing beyond resistance.
- If the open has a lot of sideways trading, traders should pay close attention to the open of the day. Trading range days often test the open of the day repeatedly.
- The most important thing to remember on the open is to be patient and wait for a good setup.
Yesterday’s Emini setups

Al created the SP500 Emini charts.
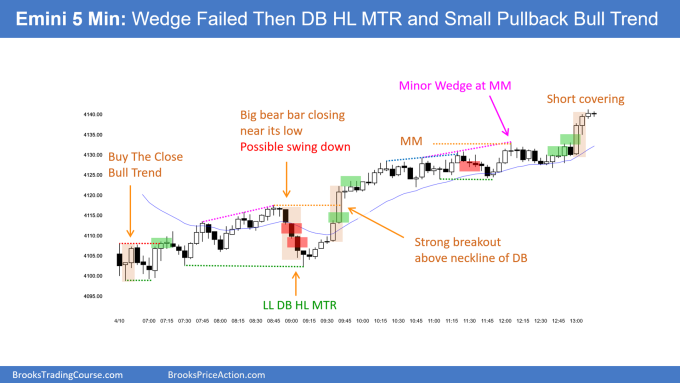
Here are several reasonable stop entry setups from yesterday. I show each buy entry with a green rectangle and each sell entry with a red rectangle. Buyers of both the Brooks Trading Course and Encyclopedia of Chart Patterns have access to a near 4-year library of more detailed explanations of swing trade setups (see Online Course/BTC Daily Setups). Encyclopedia members get current daily charts added to Encyclopedia.
My goal with these charts is to present an Always In perspective. If a trader was trying to be Always In or nearly Always In a position all day, and he was not currently in the market, these entries would be logical times for him to enter. These therefore are swing entries.
It is important to understand that most swing setups do not lead to swing trades. As soon as traders are disappointed, many exit. Those who exit prefer to get out with a small profit (scalp), but often have to exit with a small loss.
If the risk is too big for your account, you should wait for trades with less risk or trade an alternative market like the Micro Emini.
EURUSD Forex market trading strategies
EURUSD Forex daily chart

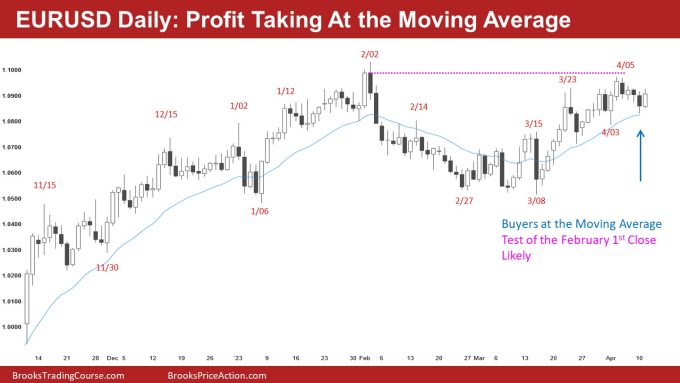
- The EURUSD is finding buyers at the moving average (blue line). The market will probably have to get closer to the February 1st close.
- The rally on April 4th is probably not enough of a test of the February 1st close. This lowered the probability of the selloff over the past couple of trading days.
- Overall, the market probably needs to get closer to the February 1st close to find out if more buyers or sellers are back at the February 1st close.
Summary of today’s S&P Emini futures price action

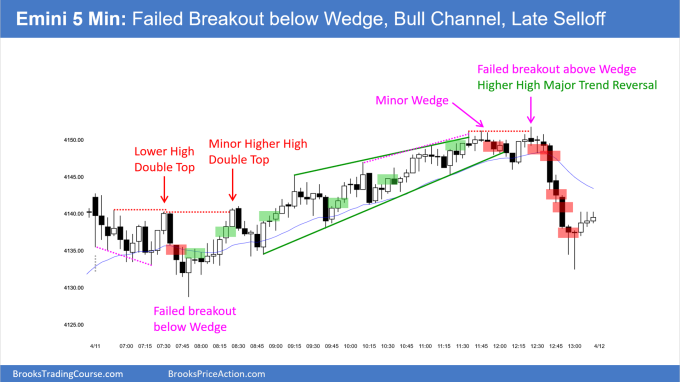
Al created the SP500 Emini charts.
End of day video review
See the weekly update for a discussion of the price action on the weekly chart and for what to expect going into next week.
Trading Room
Al Brooks and other presenters talk about the detailed Emini price action real-time each day in the BrooksPriceAction.com trading room days. We offer a 2 day free trial.
Charts use Pacific Time
When times are mentioned, it is USA Pacific Time. The Emini day session charts begin at 6:30 am PT and end at 1:15 pm PT which is 15 minutes after the NYSE closes. You can read background information on the market reports on the Market Update page.

