Trading Update: Tuesday March 7, 2023
Emini pre-open market analysis
Emini daily chart
- The Emini formed a bear bar yesterday, closing near Friday’s close. Bear first reversal down probably minor. This is more likely due to profit-taking than aggressive bears selling. The bulls that are long have a large amount of risk, and they likely need to lighten their positions and take partial profits.
- Also, the market is at logical resistance, such as the February 10th breakout point low.
- Traders know that last week’s two-bar bull breakout will likely have a second leg up. Trades do not know how deep a pullback will be before the bulls get their second leg up.
- Last week’s strong bull breakout is part of a trading range, which increases the risk of a deep pullback. It is possible that the market pullback back to the February 27th high or lower before there is a credible second leg.
- The bears want the second leg up and lead to a micro double top. Next, the bears would want a reversal down and retest of the March 1st high.
- March 1st is a bad buy signal bar (bear doji bar) which increases the risk that the market will have to reach the signal bar high over the next 2-4 weeks.
- If the market begins to go sideways and confirms that the last Friday’s bull breakout is a leg in a trading range, more and more traders will begin to sell, betting on a test of the March 1st breakout point high.
- While it is possible that bears who sold the March 1st high scaled in higher, they would likely exit here or on any minor pullback. With last week’s bull breakout being so big most traders are eager to exit any remaining shorts, which will limit the downside.
- Overall, traders should expect buyers below any pullback and a second leg up from last Friday’s breakout. However, the breakout is within a trading range, increasing the odds of a deeper pullback.
Emini 5-minute chart and what to expect today
- Emini is down 2 points in the overnight Globex session.
- The Globex market has been going sideways in a tight trading range for most of the overnight session.
- The market is in breakout mode (15-minute chart) and is deciding on an upside or downside breakout.
- Since the market is in a tight trading range (triangle) going into the open, this slightly increases the chances of a surprise breakout on the open.
- As always, traders should expect a trading range on the open and sideways.
- The market may have to go below yesterday’s low and trigger the stop entry. This means yesterday’s low will be a magnet. However, if it falls below yesterday’s low, buyers will probably not be far below.
- Overall, traders should expect a trading range day until the market has clearly broken out of the open range.
Emini intraday market update
- To follow about midday…
Yesterday’s Emini setups


Al created the SP500 Emini charts.
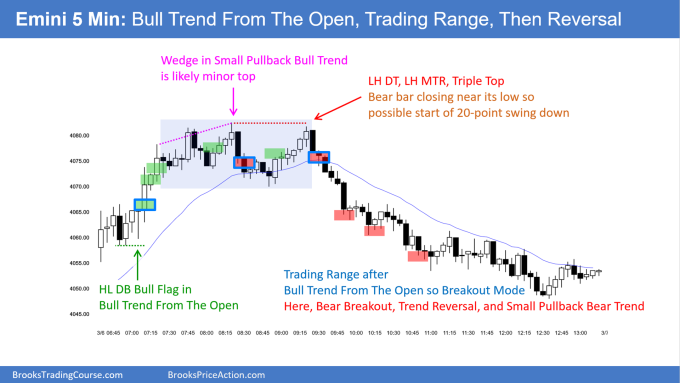
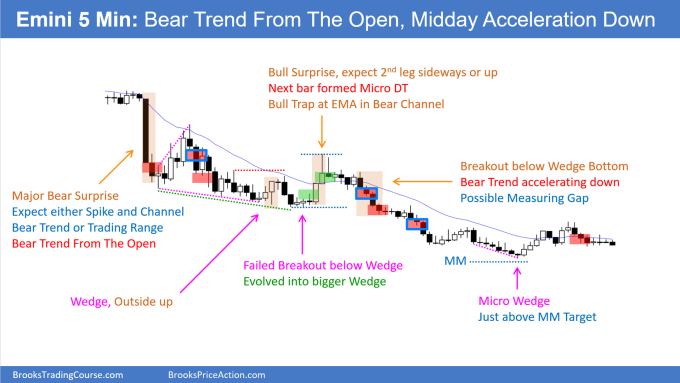
Here are several reasonable stop entry setups from yesterday. I show each buy entry with a green rectangle and each sell entry with a red rectangle. Buyers of both the Brooks Trading Course and Encyclopedia of Chart Patterns have access to a near 4-year library of more detailed explanations of swing trade setups (see Online Course/BTC Daily Setups). Encyclopedia members get current detailed setups.
My goal with these charts is to present an Always In perspective. If a trader was trying to be Always In or nearly Always In a position all day, and he was not currently in the market, these entries would be logical times for him to enter. These therefore are swing entries.
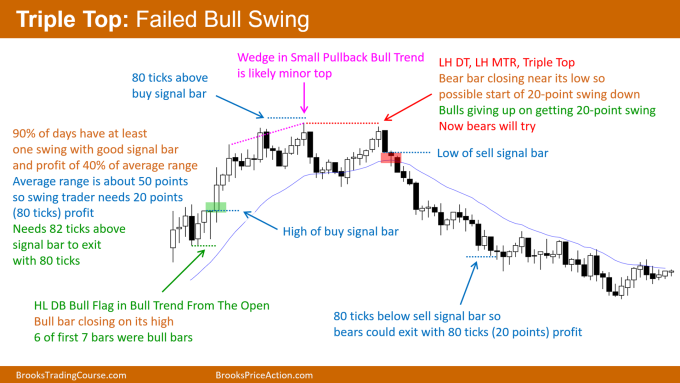
It is important to understand that most swing setups do not lead to swing trades. As soon as traders are disappointed, many exit. Those who exit prefer to get out with a small profit (scalp), but often have to exit with a small loss.
If the risk is too big for your account, you should wait for trades with less risk or trade an alternative market like the Micro Emini.
EURUSD Forex market trading strategies
EURUSD Forex daily chart

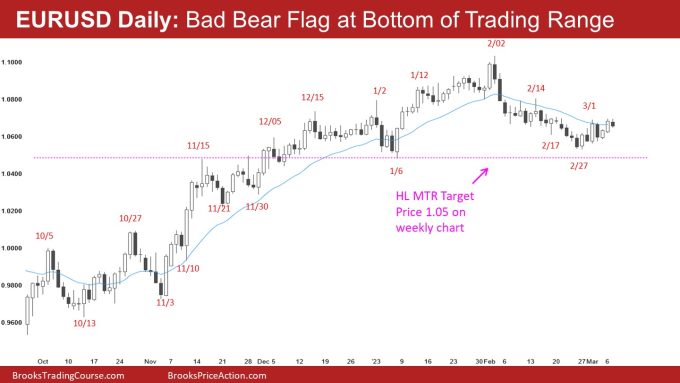
- The EURUSD yesterday formed a bull bar closing slightly above the 20-period Exponential Moving Average (EMA). This is the first close above the EMA in several bars, which increases the risk of sellers and sideways.
- The bulls want to get a bull breakout of a bear flag (February 27th to the March 1st high.
- The bears have a Low 2 short on March 2nd that failed to trigger. Now the bears want today to form a wedge top. However, the problem with this argument is that the wedge is basically a microchannel since the February 27th low.
- It is common for Trading Ranges to form bad bear flags at the bottom and bad bull flags at the top. The current bear flag is a reversal pattern on a smaller time frame. Looking at the 240-minute chart, one can see that the bulls are creating higher lows and higher highs. This increases the risk of an upside breakout and measured move-up of the past six days.
- Overall, traders will pay close attention to today to see if the bulls can get a third consecutive bull close, closing above yesterday’s high and March 1st. The bears want to create a bear trend bar closing on its low today; however, even if the bears are successful, the odds will still favor more sideways.
Summary of today’s S&P Emini futures price action and what to expect tomorrow

Al created the SP500 Emini charts.
End of day review
- Live stream video trial replacement of end of day review coming soon.
See the weekly update for a discussion of the price action on the weekly chart and for what to expect going into next week.
Trading Room
Al Brooks and other presenters talk about the detailed Emini price action real-time each day in the BrooksPriceAction.com trading room days. We offer a 2 day free trial.
Charts use Pacific Time
When times are mentioned, it is USA Pacific Time. The Emini day session charts begin at 6:30 am PT and end at 1:15 pm PT which is 15 minutes after the NYSE closes. You can read background information on the market reports on the Market Update page.

