Trading Update: Monday March 7, 2022
Emini pre-open market analysis
Emini daily chart
- The bulls want major trend reversal and hope last Friday will lead to a head and shoulders bottom, a higher low major trend reversal, and become the start of a reversal up that will test the all-time high.
- The bulls have a wedge bottom on the daily chart (December 3 and January 24).
- Since there is a wedge bottom, the bulls expect two legs up and possibly the resumption of a bull trend that will test back up to the all-time high.
- Traders do not know if January 24 was strong enough to reset the count and require the third push below the February 24 low.
- Since the market is in a trading range on the daily chart, the odds are around 50% that the market will fall at least a little below the February 24 low and possibly test the 4,000 big round number.
- There is only around a 30% chance the bear gets a bear breakout below the wedge bottom, and the market sells off to the pre-pandemic high back in March 2020.
- There is the real possibility that the February 24 low will be the low of the next several months, and the market will go sideways around this price level for the rest of the year.
- Traders need to see consecutive strong bull trend bars to convict traders that the market is going much higher and possibly back to the all-time high.
- The bulls’ problem is that the past six days have been in a tight trading range, and last Friday was a doji which is a weak signal bar so the odds favor more sideways.
Emini 5-minute chart and what to expect today
- Emini is down 8 points in the overnight Globex session.
- The bulls are trying hard to minimize any possible gap down on the open.
- Right now, the odds are the market will have a small gap down on the open.
- Traders will be open to the possibility of a trend from the open and will look for strong consecutive trend bars to swing trade.
- The market will likely go sideways to the moving average and form a limit order market.
- The bulls had a strong rally during the Globex session, with a brief failed breakout above Friday’s close. Bulls want follow-through during the U.S. Day session.
- Since last Friday is a credible, strong entry buy, the market will likely have to see what is about it and trigger it today.
- Overall, traders should expect a trading range and not swing trade until there is a strong breakout with follow-through.
Friday’s Emini setups

Al created the SP500 Emini charts.
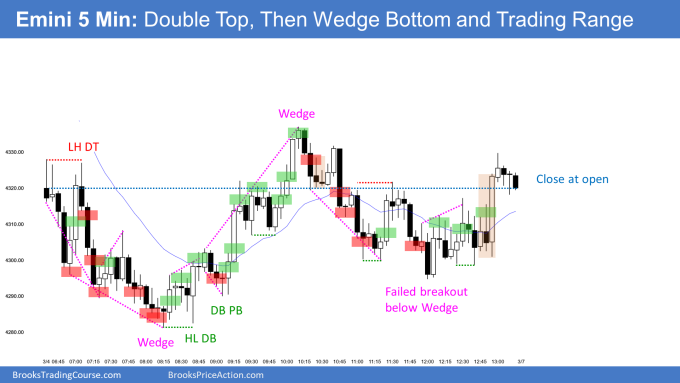
Here are several reasonable stop entry setups from Friday. I show each buy entry with a green rectangle and each sell entry with a red rectangle. Buyers of both the Brooks Trading Course and Encyclopedia of Chart Patterns have access to a much more detailed explanation of the swing trades for each day (see Online Course/BTC Daily Setups).
My goal with these charts is to present an Always In perspective. If a trader was trying to be Always In or nearly Always In a position all day, and he was not currently in the market, these entries would be logical times for him to enter. These therefore are swing entries.
It is important to understand that most swing setups do not lead to swing trades. As soon as traders are disappointed, many exit. Those who exit prefer to get out with a small profit (scalp), but often have to exit with a small loss.
If the risk is too big for your account, you should wait for trades with less risk or trade an alternative market like the Micro Emini.
EURUSD Forex market trading strategies
EURUSD Forex daily chart

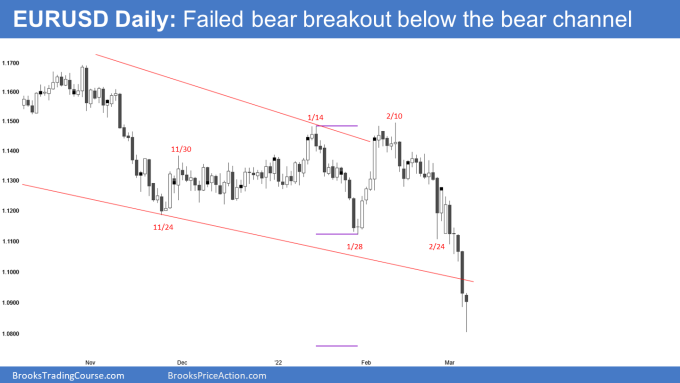
- Last Friday, the bears broke below the bear channel line and were trying to reach the March 2020 area.
- The channel down from February is tight, so the first reversal up will probably fail.
- Right now, it looks like the market will bounce for a few days due to the consecutive sell climaxes and try to test last Friday’s high.
- Again as stated above, the bear channel is tight, so the bulls will need a strong reversal up, followed by a retest of this price level to convince traders that the bulls have taken control of the market.
- The bears have an 11-bar bear micro-channel, and the bulls will probably need a micro-double bottom before they can get a credible stop entry to buy.
- The bears are bouncing just above an obvious measured move target based on the double top of the 3-month trading range.
- As stated on many blog posts, the odds are that the 3-month trading range will be a final flag, and the market will eventually test back into the midpoint of the 3-month range.
- Overall, this is a bear breakout of a bear channel, so the odds favor a failed bear breakout and a test back up into the 3-month range.
Summary of today’s S&P Emini futures price action and what to expect tomorrow

Al created the SP500 Emini charts.
End of day summary
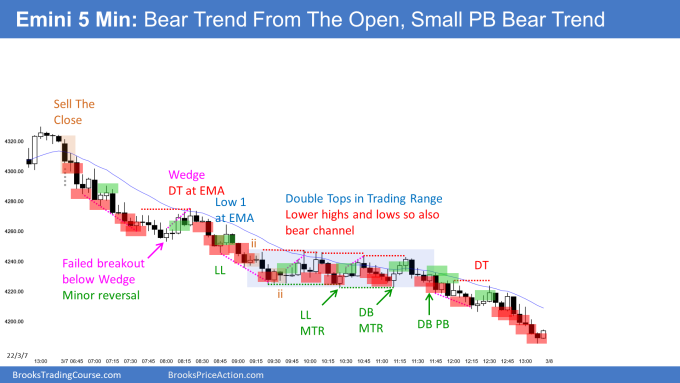
- The day was a bear trend from the open.
- It is important to recognize that while the bear bars looked weak, the channel down was tight, which means the first reversal up was likely to fail.
- Traders want to sell a pullback but do not want to risk missing out on a trend, so traders sell small pullbacks as much as possible.
- Also, the bears never get too exhausted. While the bears are getting consecutive sell climaxes, the market goes sideways long enough to relieve the exhausted bears, which is why the market goes sideways to down.
- Another thing to notice is how the bears prevented the bulls from closing above the moving average for a large portion of the day, which indicates a strong trend.
- It is important not to get sucked into the stop entry buys on a day like today because most will have poor math (low probability and bad risk/reward).
- Overall the day was a small pullback bear trend day that sold and went sideways for several hours. After the sideways trading range, the market was in breakout mode deciding on trend reversal up or trend resumption down.
See the weekly update for a discussion of the price action on the weekly chart and for what to expect going into next week.
Trading Room
Traders can see the end of the day bar-by-bar price action report by signing up for free at BrooksPriceAction.com. I talk about the detailed S&P Emini futures price action real-time throughout the day in the BrooksPriceAction.com on trading room days. We offer a 2 day free trial.
Charts use Pacific Time
When I mention time, it is USA Pacific Time. The Emini day session charts begin at 6:30 am PT and end at 1:15 pm PT which is 15 minutes after the NYSE closes. You can read background information on the market reports on the Market Update page.

