Trading Update: Tuesday July 5, 2022
Emini pre-open market analysis
Emini daily chart
- Emini bulls want higher low major trend reversal with July 1. They want this to lead to an upside breakout. The higher low is only a few bars so it might be a minor reversal up.
- Bulls can also call this a head and shoulders bottom (left shoulder May 20).
- At the moment, the odds favor a second leg up from the June 17 low.
- The bulls want to get about the June high, which would make the market either a bull trend or a trading range, and no longer a bear trend.
- The bulls want the upside breakout to June 28 and 4,000 big round number to be made up of consecutive strong bull closes. If the upside breakout looks similar to the May 27 three-bar bull breakout, that will increase the odds of higher prices.
- The bears will see any rally as part of a pullback from the June major lower high.
- Bears still have two possible double top measured move projections, which take the market below 3,650. One measured move projection is from the June high to the May low, down to around 3,445. The other projection is from the February high to February low, which projects down to 3,624.
- Currently, the market is in the middle of the past 14 trading days; this is a reminder that the market is neutral and the probability does not clearly favor one side. If one side had a 60% chance of going up or down, the market would be racing in that direction.
- Most traders are better off waiting to see the breakout of the two-week range and deciding if the breakout is strong or weak.
Emini 5-minute chart and what to expect today
- Emini is down 50 points in the overnight Globex session.
- The US session will have a large gap down.
- The odds today is that we will have a trading range open which means a limited order market.
- Traders should assume there is a 20% chance that the open will have a trend from the open.
- If there is a trend from the open, there is at least a 60% chance that the trend from the open will evolve into a trading range day.
- Since the market is likely to gap down, traders should assume the market will go sideways and reach the moving average before having a successful breakout up and down.
- Since the odds favor a trading range open, traders should expect breakouts to fail.
- Traders can consider waiting for a credible stop entry such as a double bottom/top, wedge bottom/top, or a strong breakout with follow-though.
- Traders should also remember that there is a 50% chance the initial move up or down will reverse.
Friday’s Emini setups

Al created the SP500 Emini charts.
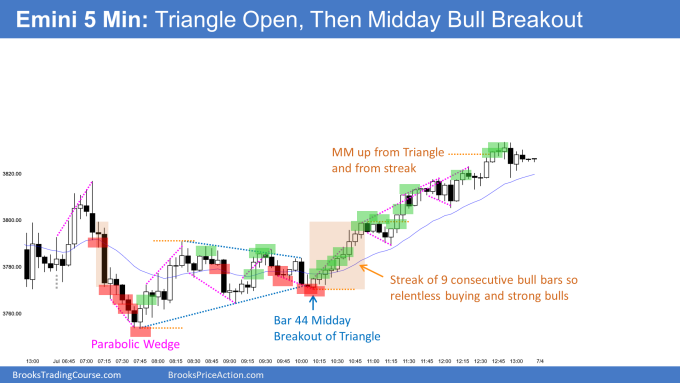
Here are several reasonable stop entry setups from last Friday (before July 4 holiday). I show each buy entry with a green rectangle and each sell entry with a red rectangle. Buyers of both the Brooks Trading Course and Encyclopedia of Chart Patterns have access to a much more detailed explanation of the swing trades for each day (see Online Course/BTC Daily Setups).
My goal with these charts is to present an Always In perspective. If a trader was trying to be Always In or nearly Always In a position all day, and he was not currently in the market, these entries would be logical times for him to enter. These therefore are swing entries.
It is important to understand that most swing setups do not lead to swing trades. As soon as traders are disappointed, many exit. Those who exit prefer to get out with a small profit (scalp), but often have to exit with a small loss.
If the risk is too big for your account, you should wait for trades with less risk or trade an alternative market like the Micro Emini.
EURUSD Forex market trading strategies
EURUSD Forex daily chart

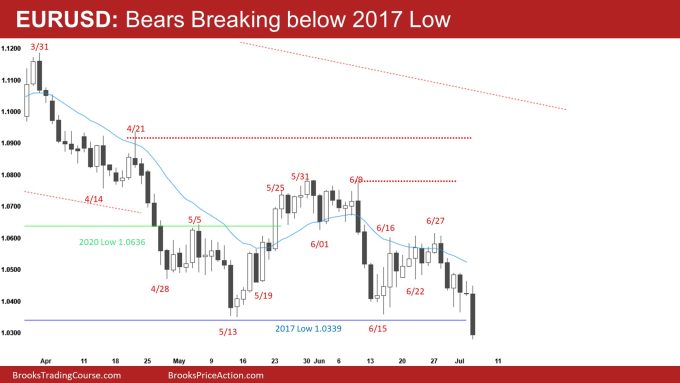
- The EURUSD broke below the 2017 low during the overnight session.
- This is a bear breakout of the past two months.
- The bears want a successful bear breakout and measured move down from the June 27th high to the June 15th bear flag low (1.0103).
- Next, the bears want a measured move down off the two-month range, which would project to under 1.0000.
- The odds are the current bear breakout below the two-month range will be a final flag, and bulls will buy soon.
- The bears need the current bar to close near its low, and they will also need follow-through tomorrow.
- More likely, today will close with a tail below the bar, which would be disappointing for the bears.
- Right now, the odds favor the bulls; however, if today and tomorrow are big bear bars closing on their lows, that would increase the odds of some measured move down.
- So far, the current bar is part of a 7-bar bear micro channel, so the bulls may need a second entry to buy before getting the reversal up.
- The first target for the bulls is the June 27 high, and the next will be the June 9th high.
Summary of today’s S&P Emini futures price action and what to expect tomorrow
- Al will post chart after the close.

Al created the SP500 Emini charts.
End of day summary
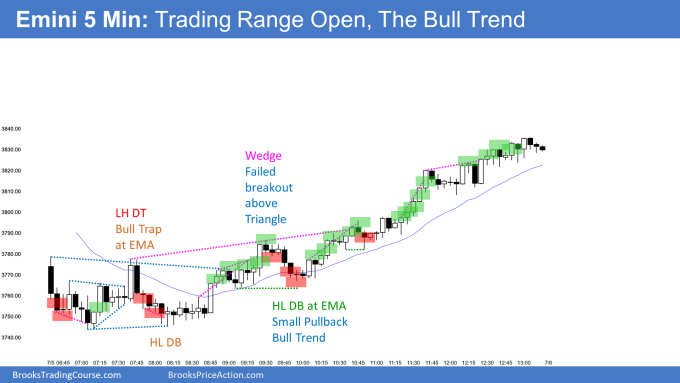
- Today was a trading range day that led to a bull trend into the close.
- On the open, the market gapped down and went sideways to the moving average.
- The market continued sideways, forming a higher low double bottom, and eventually broke out above the moving average and formed a bull trend day.
- The rally up was a small pullback bull trend, and while it is clear at the end of the day, it can be challenging to spot in real-time.
- Small pullback trends evolve from trading ranges that begin to form gaps. This makes it difficult to see when the market is trending.
- In general, when you think the market is becoming a small pullback bull trend, it is best to trade like Forrest Gump as Al often says and buy at least a small position just in case the market keeps going up today.
- Tomorrow is an FOMC release at 11:00 PT, so traders should go flat going into the report and wait for 2 bars after the report before trading again.
See the weekly update for a discussion of the price action on the weekly chart and for what to expect going into next week.
Trading Room
Traders can see the end of the day bar-by-bar price action report by signing up for free at BrooksPriceAction.com. Al talks about the detailed S&P Emini futures price action real-time throughout the day in the BrooksPriceAction.com on trading room days. We offer a 2 day free trial.
Charts use Pacific Time
When times are mentioned, it is USA Pacific Time. The Emini day session charts begin at 6:30 am PT and end at 1:15 pm PT which is 15 minutes after the NYSE closes. You can read background information on the market reports on the Market Update page.

