Trading Update: Wednesday January 11, 2023
Emini pre-open market analysis

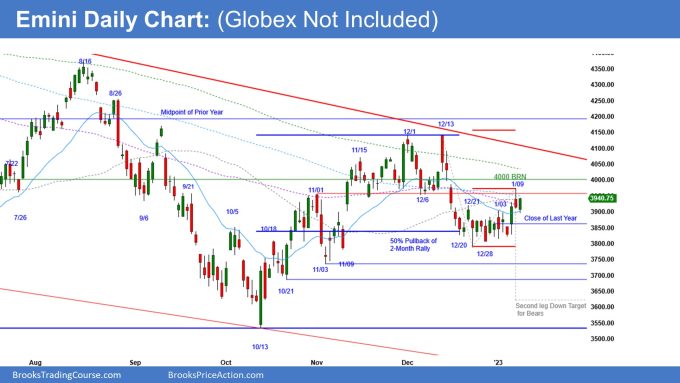
Emini daily chart
- Yesterday reversed up from below Monday’s bear signal bar and formed a bull bar closing on its high.
- The bulls will see this as a breakout pullback buy setup. Bulls want today to trigger the buy and close above Monday’s (January 9th) bear bar.
- Bulls measuring gap and measured move up wanted to trap the bears into a bad short (Monday) and to get up to the December 13th high. While the bulls may get a measuring gap above the January 9th bear bar, it is not a high probability.
- The bulls need to get consecutive strong bull closes before traders become convinced that the bulls are getting a bull breakout of a bear flag, and the market will try for the measured move up to the December 12th high.
- If the bulls get the upside breakout, one obvious target is the top of the bear trend line above. The market came close to it on December 13th but failed to reach it.
- The bears see January 9th as a credible short. This means there will be bears sold below January 9th and are willing to scale in higher, possibly around the 4,000 big round number. This increases the odds of a breakout above January 9th, leading to more sideways trading.
- This risk the bears face right now is a tight bull channel (think small pullback bull trend behavior) that traps the bears into a bad trade. If the bulls do beg a breakout here, it could trap bears on the wrong side of the market and squeeze them out at a higher price.
- The bears want a failed breakout above January 9th (assuming the market goes above it) and a second entry short for a second leg down from the December 20th selloff.
- Right now, the bears still have a negative gap with the December 6th low. The bulls need to close above the December 6th low; otherwise, it increases the odds that the market will get a second leg down to the November lows.
- Remember, legs typically have symmetry, which means the bears still have a reasonable argument of a second leg down from the December 13th selloff that is comparable in size. While the pullback from the December 13th selloff has many bull bars, the bears are not out of the fight yet. Therefore, traders need to be open to the possibility of a second leg down from the December 12th selloff, which could fall below the October 21st low.
- Overall, the market is in a trading range, which means traders should expect sideways and disappointment. If a trader wants high probability, they need to wait for 2-3 strong consecutive trend bars and for one side to take control, which has not happened yet clearly.
Emini 5-minute chart and what to expect today
- Emini is up 14 points in the overnight Globex session.
- The market has continued up in a broad channel since the early morning hours.
- The bears are accumulating selling pressure, increasing the odds that the upside will be limited, and the market will begin to go sideways to down.
- While the market may continue higher, it is more likely that today will have a lot of trading range price action and disappoint the bulls.
- As always, traders should expect a lot of trading range trading on the open. This means most traders should consider not trading for 6-12 bars if they are uncomfortable with limit order trading.
- While the open often has good swing trade setups, there are often a lot of failed breakouts. This makes it easy to get trapped into a bad breakout and to take a big loss.
- If the day is going to become a trend from the open, there will be plenty of time to get in the direction of the trend.
- Traders can also wait for a double top/bottom or a wedge top/bottom, which often presents a good swing trade within the first two hours.
- A trader can also wait for a clear breakout with follow-through, breaking out, and enter for a second leg.
- The single most important thing on the open is to be patient. There will always be a trade later, so there is never a rush to enter.
- If the day has a lot of trading range price action, traders should pay attention to the open of the day, especially if it is in the middle of the day’s range.
Emini intraday market update
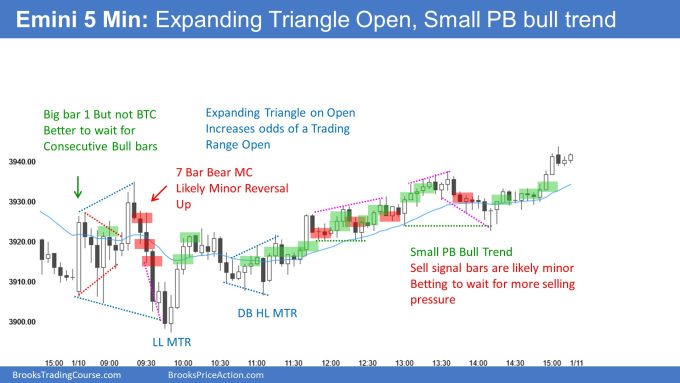
- The Emini gapped up on the open and went sideways for the first two hours of the day.
- The market touched the moving average, and the bulls are trying to get an upside breakout of the bar 4 high.
- At the time of writing this, 8:55 AM PT the bulls are hopeful that the market is forming a small pullback bull trend. They want to create open gaps and trap bears selling at the top of the trading range.
- At the moment, the market is probably Always In Long, but the bulls really need to get a strong breakout and follow-through above the high of bar 4, or else traders will expect more trading range price action to follow.
- So far, the range is less than 20 points and will likely double in size.
- The January 9th high is a magnet, and the bulls want the day to close above it, increasing the odds of bears buying back shorts on the daily.
- Overall, traders should wait for more selling pressure or wait for a clear upside breakout and follow-though above bar 4.
Yesterday’s Emini setups

Brad created the SP500 Emini charts.
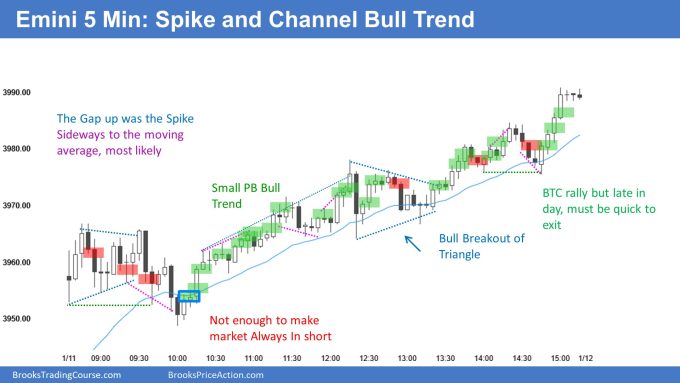
Here are several reasonable stop entry setups from yesterday. I show each buy entry with a green rectangle and each sell entry with a red rectangle. Buyers of both the Brooks Trading Course and Encyclopedia of Chart Patterns have access to a much more detailed explanation of the swing trades for each day (see Online Course/BTC Daily Setups).
My goal with these charts is to present an Always In perspective. If a trader was trying to be Always In or nearly Always In a position all day, and he was not currently in the market, these entries would be logical times for him to enter. These therefore are swing entries.
It is important to understand that most swing setups do not lead to swing trades. As soon as traders are disappointed, many exit. Those who exit prefer to get out with a small profit (scalp), but often have to exit with a small loss.
If the risk is too big for your account, you should wait for trades with less risk or trade an alternative market like the Micro Emini.
EURUSD Forex market trading strategies
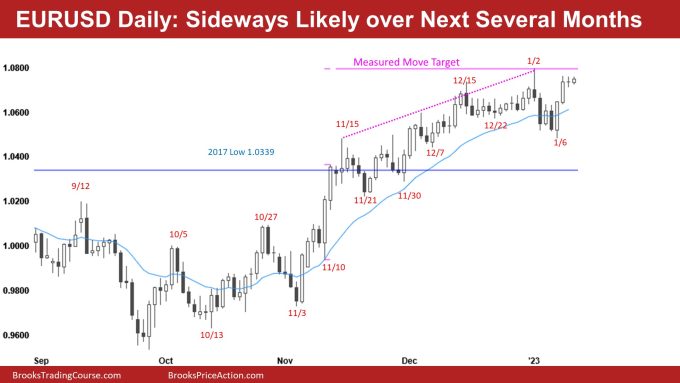
EURUSD Forex daily chart

- The bulls got a surprise breakout with follow-though on January 6th.
- While the odds favor a second leg up, the problem bulls face is that the breakout is testing the top of a likely trading range. This increases the risk that any breakout above the January high will fail, and the market will continue to go sideways.
- The bears want the market to form a double top with January 2nd; however, the breakout on January 6th is strong enough for the market to get at least a small second leg up.
- The bears will probably wait for a second leg to see what happens above the January 2nd high.
- Overall, the market will likely try and form some major trend reversal and continue sideways. The odds still favor a 300-pip pullback, so the weekly chart can attempt to form a higher low major trend reversal.
- The selloff since Mid-2021 was tight; therefore, the first reversal up will likely fail on the weekly chart without a pullback and test down, forming a higher low major trend reversal. Traders should expect sideways to down over the next couple of months.
Summary of today’s S&P Emini futures price action and what to expect tomorrow

Brad created the SP500 Emini charts.
End of day review
- I will update at the end of the day.
See the weekly update for a discussion of the price action on the weekly chart and for what to expect going into next week.
Trading Room
Al Brooks and other presenters talk about the detailed Emini price action real-time each day in the BrooksPriceAction.com trading room. We offer a 2 day free trial.
Charts use Pacific Time
When times are mentioned, it is USA Pacific Time. The Emini day session charts begin at 6:30 am PT and end at 1:15 pm PT which is 15 minutes after the NYSE closes. You can read background information on the market reports on the Market Update page.

