Trading Update: Wednesday March 20, 2024
End of day video review
S&P Emini pre-open market analysis
Emini daily chart
- The Emini rallied yesterday after testing near the daily moving average and closed on its high. The bulls are hopeful that today will lead to an upside breakout and follow-through buying of the triangle, a breakout mode pattern.
- The bulls hope today will lead to a strong entry bar above yesterday’s high.
- The daily chart is in a tight trading range, increasing the risk of the bulls getting disappointed with the follow-through buying above yesterday’s high.
- Tight trading ranges generally have close to a 50% probability of a breakout up or down.
- Because the market is holding above the 20-period Exponential Moving Average, the probability might be 54% for the bulls, which means the bulls have a slight probability advantage.
- Until the bears can get strong closes below the moving average, traders will continue to assume that the market will go higher.
- Overall, the daily chart is in a small pullback bull trend. These types of trends can last a long time and can rally much further than what one thinks.
- It is a dangerous market to sell, so most bears need to see more selling pressure before committing to short positions.
Emini 5-minute chart and what to expect today
- Emini is down 2 points in the overnight Globex session.
- The Overnight Globex market has been in a tight trading range since yesterday’s close.
- Traders are deciding if yesterday’s rally will get a 2nd leg up or a deep pullback to the midpoint of yesterday’s rally.
- The higher time frames have had a lot of trading range price action. This increases the risk of the bulls getting a deep pullback before getting a second leg up.
- There is an 80% chance of a trading range on the open and only a 20% chance of a trend from the open.
- Trading ranges always have a variation of a double top/bottom, or wedge top/bottom, which means there is an 80% chance of one of the patterns mentioned above forming. This means that there is no rush to trade on the open as a trader can wait for a stop entry and enter a position based on one of the above patterns forming.
- As I often say, most traders should avoid trading the first 6-12 bars on the open.
- Most traders should focus on the opening swing. It is common to get a swing trade beginning before the end of the second hour that last for at least two hours and two legs. This provides a great risk-reward trade.
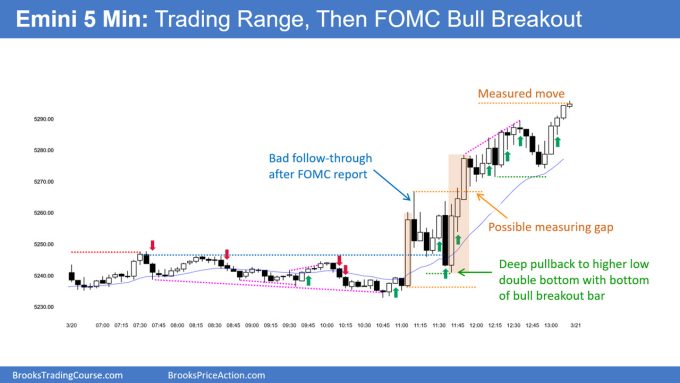
- Today is an FOMC day, meaning traders should be flagged at least 30 minutes before the report at 2:00 PM EST.
- Trades should wait at least 10 minutes after the report is released before placing a trade.
- Lastly, traders should trade 20% of their normal position size during the report. Bars after FOMC are often big; therefore, one must reduce their risk exposure.
Yesterday’s Emini setups

Al created the SP500 Emini charts.
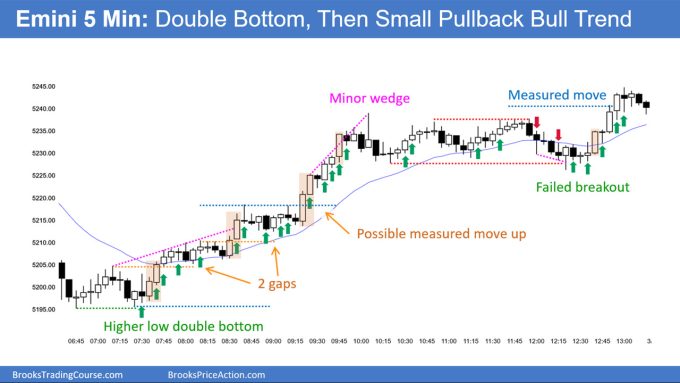
Here are reasonable stop entry setups from yesterday. I show each buy entry bar with a green arrow and each sell entry bar with a red arrow. Buyers of both the Brooks Trading Course and Encyclopedia of Chart Patterns have access to a near 4-year library of more detailed explanations of swing trade setups (see Online Course/BTC Daily Setups). Encyclopedia members get current daily charts added to Encyclopedia.
My goal with these charts is to present an Always In perspective. If a trader was trying to be Always In or nearly Always In a position all day, and he was not currently in the market, these entries would be logical times for him to enter. These therefore are swing entries.
It is important to understand that most swing setups do not lead to swing trades. As soon as traders are disappointed, many exit. Those who exit prefer to get out with a small profit (scalp), but often have to exit with a small loss.
If the risk is too big for your account, you should wait for trades with less risk or trade an alternative market like the Micro Emini.
EURUSD Forex market trading strategies
EURUSD Forex daily chart

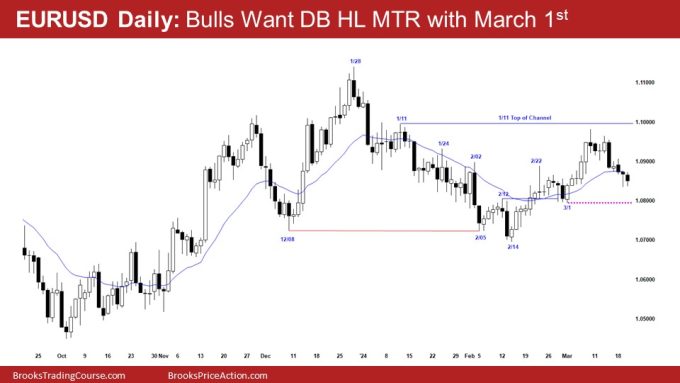
- The EURUSD is getting a second leg down from the March 14th surprise bear breakout bar.
- The bears are hopeful they will be able to break below the March 1st low and ultimately get down to the February 14th low.
- Because the rally up from the February 14th low is tight, the odds favor any reversal down to the March 1st low being minor.
- The bears ultimately need to exert more selling pressure. Otherwise, the daily chart is likely going to continue to go sideways in a trading range.
- Overall, the March 1st low is likely going to act as support, and the EURUSD will likely find buyers near its low.
Summary of today’s S&P Emini price action

Al created the SP500 Emini charts.
See the weekly update for a discussion of the price action on the weekly chart and for what to expect going into next week.
Trading Room
Al Brooks and other presenters talk about the detailed Emini price action real-time each day in the BrooksPriceAction.com trading room days. We offer a 2 day free trial.
Charts use Pacific Time
When times are mentioned, it is USA Pacific Time. The Emini day session charts begin at 6:30 am PT and end at 1:15 pm PT which is 15 minutes after the NYSE closes. You can read background information on the market reports on the Market Update page.

