Trading Update: Thursday March 17, 2022
Emini pre-open market analysis
Emini daily chart
- Yesterday, the bulls had a strong entry bar following the truncated wedge (January, February, and the March 8 Double bottom). A breakout of wedge bottom.
- The bulls are hopeful that this is the start of two legs up that will lead to a rally testing the all-time high.
- More likely, whatever rally we get will disappoint and lead to a bull leg in a trading range.
- The bulls’ first target is the March 3 lower high and the 4,400 round number.
- The bears hope that the market will hesitate at the March 3 lower high and continue sideways.
- The bulls want a strong breakout above with follow-through confirming the market is always in long.
- While yesterday is undoubtedly good for the bulls, traders need to remember the market is still in a likely trading range, which means traders should expect the bulls to be disappointed soon.
- The bull rally over the past two days is probably strong enough for a second leg up. The second leg may last a few bars (days), or it can last several bars.
- Some bulls bought February 25, used a wide stop, and likely bought lower. Traders will pay attention to what happens back at the February 25 close.
- Will those bulls who bought buy more, or will they be disappointed by the pullback in March and sell out of longs at the February 25 close.
- Nobody knows at this moment; however, if the market races past the February 25 close, that will be a sign of strength by the bulls.
- Overall, the bulls are hopeful this is the resumption of the bull trend that will test the all-time high, and the bears are hopeful that the market will stall soon and form another lower high in the bear’s channel leading to a breakout below the February low.
Emini 5-minute chart and what to expect today
- Emini is down 18 points in the overnight Globex session.
- The overnight session had a large two-legged selloff. The bears hope for this large pullback in the early stages of a bear trend reversal (Major trend reversal). More likely, the best the bears can expect is a trading range.
- Even if the market rallies back to the Globex high, bears will attempt to form another major trend reversal setup
- The past two trading days were strong enough to increase the odds of the market going higher, so traders should look for any selloff on the open to fail and look for a rally.
- Overall, traders should expect the market to likely form a trading range day and test the open of the day several times today. This means that traders should look for breakouts at the low and high of the day to fail and fade them.
Yesterday’s Emini setups

Al created the SP500 Emini charts.
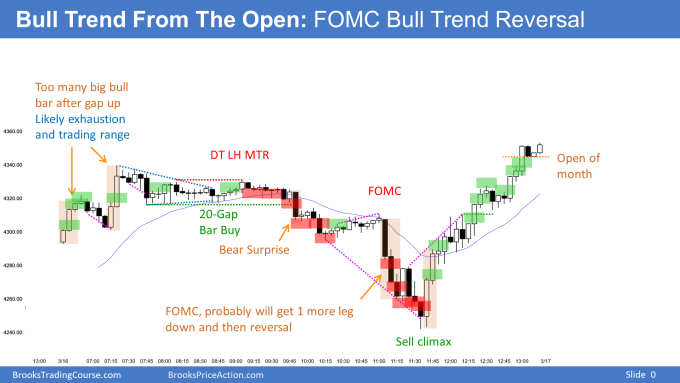
Here are several reasonable stop entry setups from yesterday. I show each buy entry with a green rectangle and each sell entry with a red rectangle. Buyers of both the Brooks Trading Course and Encyclopedia of Chart Patterns have access to a much more detailed explanation of the swing trades for each day (see Online Course/BTC Daily Setups).
My goal with these charts is to present an Always In perspective. If a trader was trying to be Always In or nearly Always In a position all day, and he was not currently in the market, these entries would be logical times for him to enter. These therefore are swing entries.
It is important to understand that most swing setups do not lead to swing trades. As soon as traders are disappointed, many exit. Those who exit prefer to get out with a small profit (scalp), but often have to exit with a small loss.
If the risk is too big for your account, you should wait for trades with less risk or trade an alternative market like the Micro Emini.
EURUSD Forex market trading strategies
EURUSD Forex daily chart

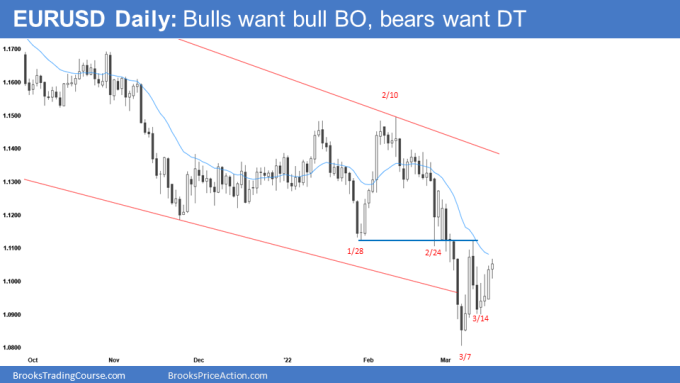
- The bulls got a strong close yesterday, which increases the odds that the market is going higher and that the low of the next several months is in.
- Bulls want to get consecutive bull bars and hope today is a very strong bull close that will lead to a rally back into the 3-month trading range.
- The EURUSD came within five pips of testing at the March 9 close, so as expected, there is some profit-taking back at the March 9 close. March 9 was a reasonable bar to buy, especially if a trader could use a wide stop and scale in lower (which is likely what traders did that are taking profits here).
- Bears want today to close on its low and form a Low 2. The problem the bears have is all the buying pressure, and the past three days have had a bull close. Also, the low of the 3-month trading range is an obvious magnet above, and the market will probably have to test the middle of the 3-month trading range.
- So, if the odds are the market is going to test the middle of the 3-month trading range, why not just buy right now? One can do that. However, they must know how to manage the trade because the market could fall below the March low and reverse up back into the 3-month trading range.
- Also, it is still possible that the market has to test back down to the March 11 low and form a double bottom higher low before going much higher.
- While yesterday is a good bar for the bulls, they need more buying pressure, such as two or three strong bull closes. That would be enough to convince traders that the market is clearly always in long and likely to test the February high.
- The bears want a double top with the March 9 high followed by a test back down to the March low.
- Overall, the odds are the 3-month trading range will be a final flag, and the market will at least test back into the middle of the 3-month trading range.
Summary of today’s S&P Emini futures price action and what to expect tomorrow

Al created the SP500 Emini charts.
End of day summary
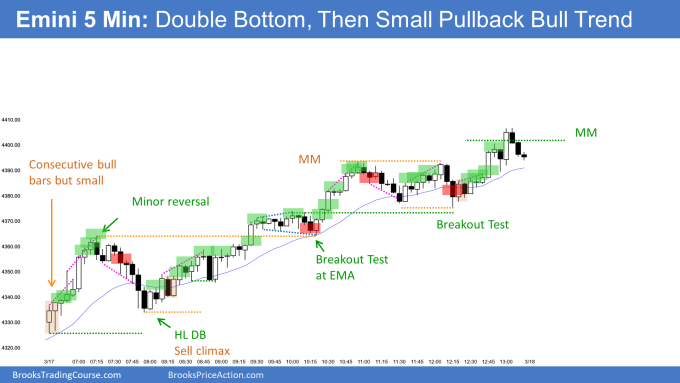
- The bulls had a trend from the open that tested yesterday’s high, which was followed by a deep pullback back to the high of bar 1.
- The market tried to form a trading range around the 9:00 AM PT test of the high of the day. However, the bulls got a breakout of the 2-hour range, leading to a measured move up.
- The day was mostly a small pullback bull trend from around 8:00 PT to around 11:00 PT. The difficult part about a small pullback bull trend is that it always looks like it will reverse.
- By the time you get a bull breakout like the 9:25 PT, the market goes sideways for 12 bars before it resumes up.
- When a trader confirms the market is in a small pullback bull trend, it is important to find a reason to get long, such as a pullback to the moving average, and look to enter at least a small position, just in case the market rallies far.
- It is essential to realize that in a small pullback bull trend, the move is never quite as strong as traders want, so it causes traders to look to enter on pullbacks. So, while the market can appear weak, it is a tight channel which is a breakout on a higher time frame.
See the weekly update for a discussion of the price action on the weekly chart and for what to expect going into next week.
Trading Room
Traders can see the end of the day bar-by-bar price action report by signing up for free at BrooksPriceAction.com. I talk about the detailed S&P Emini futures price action real-time throughout the day in the BrooksPriceAction.com on trading room days. We offer a 2 day free trial.
Charts use Pacific Time
When I mention time, it is USA Pacific Time. The Emini day session charts begin at 6:30 am PT and end at 1:15 pm PT which is 15 minutes after the NYSE closes. You can read background information on the market reports on the Market Update page.

