Emini breakout before Senate vote on Trump tax cut
Updated 6:55 a.m.
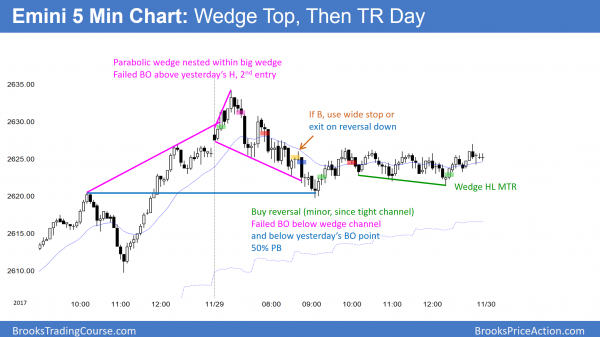
The Emini gapped to a new all-time high. Yet, the low of the day was the open of the 1st bar. That happens about 5 times a year, and in 4 of those times, the Emini usually trades below the low at some point. Only about once a year will a bar on the daily chart have either no tail on its top or bottom.
The 2nd bar was a bear bar, which is bad follow-through after the strong 1st bar. The bears got a 2nd failed breakout above yesterday’s high. Yet, the follow-through has been bad. This increases the chances of a trading range open for the 1st hour. Furthermore, it reduces the odd of a big bear day.
This early hesitation reduces the chances of a big bull day. The bulls are now hoping for a double bottom or a wedge bull flag around the moving average. If they get it, today will probably be a weak bull trend, and mostly a trading range day.
Pre-Open market analysis
Yesterday was a trading range day after Tuesday’s strong bull breakout. The bulls hope that it is just a pause in a new leg up. However, because it was not a strong follow-through day, there is only a 50% chance of much follow-through over the next week.
The bears stopped the momentum of the bulls by creating a small bear bar yesterday. They therefore see yesterday as a sell signal bar for the failed breakout above a wedge top on the daily chart. Yet, Tuesday’s rally was so strong that the odds favor buyers below yesterday’s low. There is only a 40% chance of a reversal down and a failed breakout.
Since yesterday was a sell signal bar, today will probably trade below yesterday’s low. The market usually tests important support or resistance when it is close, and then decides on the breakout or the reversal. However, Tuesday was so climactic that the market might need to go sideways for several days before deciding whether to resume up or reverse down.
Last day of the month
Since today is the last day of the month, it affects the appearance of the monthly chart. At the moment, this month is a bull trend bar closing near its high. If today is sideways or up, that will be how the monthly bar will look once it closes.
However, if the bears get a 20 point selloff today, the monthly chart will have a conspicuous tail on the top of this month’s bar. That would indicate some loss of momentum. If today was a huge bear day and closed below the open of the month, the month would be a bear reversal bar. That would require more than a 40 point selloff, which is extremely unlikely.
Overnight Emini Globex trading
The Emini is up 8 points in the Globex market. Tuesday’s rally was so strong that the odds favored follow-through buying at some point over the next week. The bulls are trying to begin it today. Since yesterday was a tight trading range, there is an increased chance of more trading range trading today.
Tuesday’s breakout was so strong that it might be exhaustive. Consequently, there is an increased chance of a double top with Tuesday’s high. That would create a micro double top on the daily chart. Yet, the odds would favor simple more sideways bars instead of a reversal down on the daily chart. Therefore, the downside risk over the next few days is small. If the bears get a strong bear day, it will probably have bad follow-through selling. At least slightly higher prices are more likely than a reversal down.
Because today will test Tuesday’s buy climax high, traders will be ready for either a strong rally far above, or a reversal down. However, Tuesday was so extreme that today will probably be another rest day. This means that a trading range is most likely.
Yesterday’s setups
Here are several reasonable stop entry setups from yesterday. I sometimes also show limit order entries and entries on the close of bars.
EURUSD Forex market trading strategies
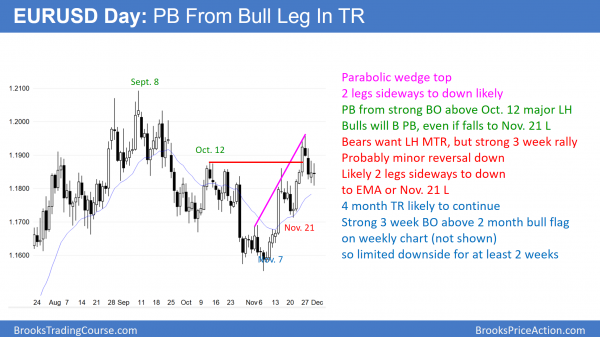
The EURUSD daily Forex chart is pulling back to support after last week’s strong breakout above The October 12 major lower high. Less likely, this is the start of a bear trend down from a lower high major trend reversal.
The EURUSD daily Forex chart has reversed down for 4 days. Yet, it is stalling at the support of the October highs and just above the 20 day exponential moving average. Furthermore, the 4 day selloff looks weak compared to the 3 week rally. Finally, trading ranges resist breaking out. Consequently, this selloff if probably a bear leg in the 4 month range and not the start of a bear trend.
This is the 1st leg down from a 3 week parabolic wedge top. Reversals down from wedge tops usually have at least 2 legs sideways to down. In addition, a pullback usually does not last more than about half as long as the bull trend. Therefore, this 4 day selloff will probably have a 2nd leg sideways to down over the next week. Then, the bulls will buy again and try to break above the top of last week’s wedge.
Overnight EURUSD Forex trading
The EURUSD 5 minute Forex chart has been in an 80 pip range for 3 days. The bulls want to rally back up to last week’s high. However, because of the wedge top on the daily chart, any rally to around 1.1900 will probably be a lower high. It would then lead to a 2nd leg sideways to down.
The bears want the selloff to go directly down to the November 21 low. While possible, the 3 day trading range makes a rally to 1.1900 more likely. However, that rally would likely reverse back down, possibly to the November 21 low.
The odds are against a big move up or down over the next few days. The daily chart is in a pullback, and pullbacks usually are made of mostly neutral trading. Consequently, traders will probably be mostly scalping this week.
Summary of today’s S&P Emini futures price action and what to expect tomorrow
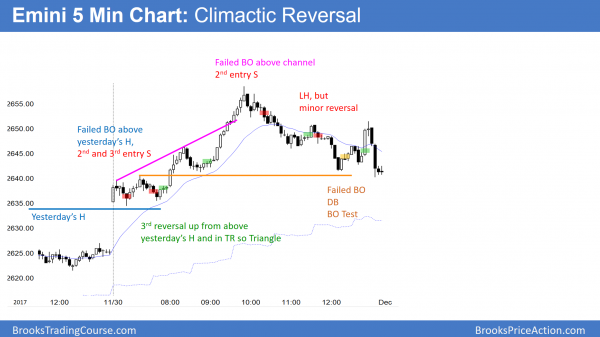
The Emini rallied strongly today, but reversed down from a bull breakout above the bull channel. The reversal was also a parabolic wedge top on the 60 minute chart.
Today was another strong buy climax. Since there is now a parabolic wedge top on the 60 minute chart, the odds favor about 10 bars sideways to down on the 60 minute chart. This means that the Emini will probably pull back for a day or two.
See the weekly update for a discussion of the price action on the weekly candlestick chart and for what to expect going into next week.
Traders can see the end of the day bar-by-bar price action report by signing up for free at BrooksPriceAction.com. I talk about the detailed S&P Emini futures price action real-time throughout the day in the BrooksPriceAction.com trading room. We offer a 2 day free trial.
When I mention time, it is USA Pacific Standard Time (the Emini day session opens at 6:30 am PST, and closes at 1:15 pm PST). You can read background information on the intraday market reports on the Intraday Market Update page.


