Emini breakout attempt above triangle as earnings season begins
I will update again at the end of the day
Pre-Open market analysis
The Emini gapped up above Wednesday’s close and rallied yesterday, but then went sideways. The bulls are trying to break above the 3 week trading range. However, the bears are trying to get a reversal down. If the bulls can get consecutive big bull bars over the next few days, they will probably get a rally to 2800. In addition, if they get a gap up today or Monday, there will be a 3 week island bottom on the daily chart. That is a bullish pattern, given the bull trend on the monthly chart. The bears need a strong sell signal bar or a strong reversal down before traders will look for another leg down.
Overnight Emini Globex trading
The Emini is up 14 points in the Globex market. The day session therefore might gap above yesterday’s high. If the gap is small, it will probably close within the 1st hour. If it is big, there would be an increased chance of a bull trend day. The bulls would have a 3 week island bottom and a reversal up from a test of the February low. Since the monthly chart is in a bull trend, this would increase the odds of a rally up to 2800 over the next few weeks.
Because the Emini is at the top of a 3 week trading range, day traders have to be prepared for a reversal down. With earning season beginning next week, the Emini has an increased chance of forming a 4th small trading range day today. The past 3 days were doji days on the daily chart.
Yesterday’s setups
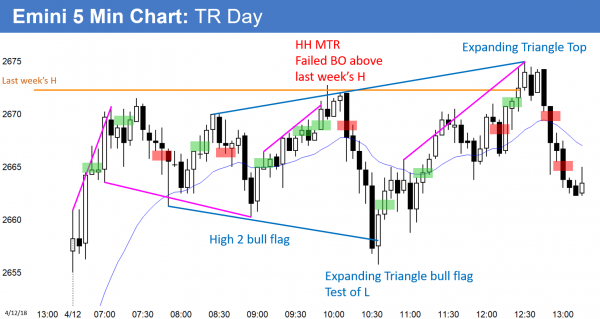
Here are several reasonable stop entry setups from yesterday. I sometimes also show limit order entries and entries on the close of bars.
EURUSD apex of a triangle
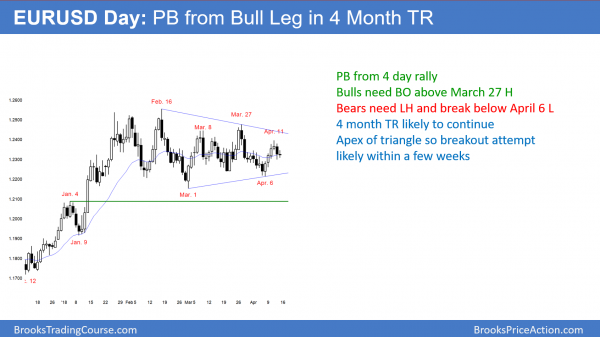
The EURUSD daily Forex chart pulled back for 2 days from a 4 day rally. The odds favor at least a small 2nd leg up. However, there is no sign that the 4 month trading range is about to break out. Because the chart is at the apex of a triangle, the odds favor a breakout attempt within a few weeks.
The EURUSD daily Forex chart pulled back for 2 days from a 4 day rally. The rally was strong enough so that the odds favor at least a small 2nd leg up. Yet, the overriding feature is that the chart is in a 4 month trading range. Trading ranges resist breaking out. Consequently, traders have been exiting trades in a week or less. Since there is no sign of an impending breakout, traders will continue to look for brief trades.
After 4 bull days, the odds favor at least a one day rally within a few days. However, the bears will then try to create a micro double top.
Because the trading range is now a triangle, the chance of a breakout within a few weeks is higher. The 1st breakout from a triangle reverses 50% of the time. When there finally is a successful breakout, in general, there is about a 50% chance that it will be up and a 50% chance it will be down. Since this triangle is a bull flag on the weekly chart, the odds are about 55% for the bulls.
Overnight EURUSD Forex trading
The EURUSD 5 minute Forex chart has been in a 40 pip range overnight. The bulls are trying to create a double bottom with yesterday’s low. The neckline is the overnight high. Since the height is about 40 pips, that is the minimum target for a breakout up or down. A bull breakout would test the high from 2 days ago. A bear breakout would make the daily chart more neutral. A 40 pip selloff would still be a continuation of the 2 day pullback and not a bear leg. The bears need a break below the April 6 low to take temporary control.
Because the overnight trading has been in a tight range, the odds are that today will remain small. That means that day traders will scalp today, expecting a breakout next week.
Summary of today’s S&P Emini futures price action and what to expect tomorrow
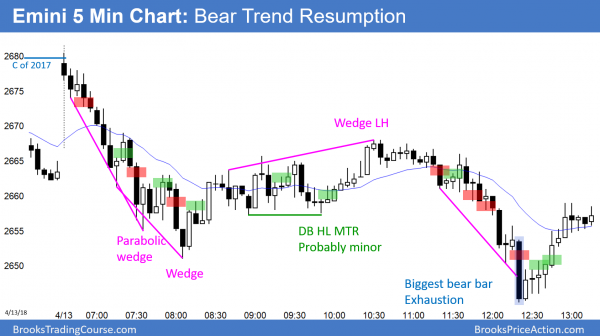
The Emini reversed down from above yesterday’s high and then up from below yesterday’s low. Today was therefore an outside down day. The late selloff created a bear trend resumption day. There was strong profit taking into the close.
Today gapped up, forming a 3 week island bottom. However, the gap was small and it immediately closed. The Emini was also briefly back above last year’s close. There was a midday wedge rally that led to trend resumption down at the end of the day.
Today was a big bear bar and therefore a sell signal bar for Monday. The bears see today as a failed breakout. They therefore want a reversal down to the bottom of the range. However, it was an outside down bar in a 4 day tight range. In addition, it had a big tail below. The Emini will probably continue its 4 day tight trading range.
It has not yet clearly rejected the bull breakout. Traders should find out next week if the bulls will succeed or the bears will get a test of the February low.
See the weekly update for a discussion of the price action on the weekly candlestick chart and for what to expect going into next week.
Traders can see the end of the day bar-by-bar price action report by signing up for free at BrooksPriceAction.com. I talk about the detailed S&P Emini futures price action real-time throughout the day in the BrooksPriceAction.com trading room. We offer a 2 day free trial.
When I mention time, it is USA Pacific Standard Time (the Emini day session opens at 6:30 am PST, and closes at 1:15 pm PST). You can read background information on the intraday market reports on the Intraday Market Update page.


