Trading Update: Friday July 30, 2021
Emini pre-open market analysis
Emini daily chart
- Yesterday was the entry bar for a High 1 bull flag buy signal. Yesterday was a reversal day because it closed near the low. However, it had a bull body and it is therefore a lower probability sell signal bar. Now 6th consecutive bull bar on monthly chart.
- If the bears get a reversal down from here, the context would be good. This is because it would be from a micro double top with Monday’s high and an expanding triangle top (July 7 and July 14 were the 1st 2 highs). Also, it would be from just below the trend channel line created with the May 7 and July 14 highs.
- Because the daily chart is in a strong bull trend, it continues to break above resistance. Traders will keep betting that every 1- to 3-day selloff will lead to a new high until there is a strong reversal down.
- Today is the final trading day in July. July has a big bull body and it should still have a bull body when the month closes today because the open of the month is 100 points down. That is probably too far to reach in one day.
- The bull body would make at least slightly higher prices likely in August.
- This is the 6th consecutive month with a bull body on the monthly chart. That has not happened in 10 years.
- Since a 7th consecutive bull bar would be even more rare, August should have a bear body. That means August should close below the open of the month. This is true even it it rallies strongly for several weeks.
- If August has a bear body, there would be a parabolic wedge on the monthly chart. That should lead to a 15 to 20% correction over the following month or two.
- Most bars on all charts have conspicuous tails on the top and bottom. July is currently at the high of the month. That increases the chance that it will finish the month at least 30 – 50 points below the high of the month.
Emini 5-minute chart and what to expect today
- Emini is down 30 points in the overnight Globex session.
- Today will have a big gap down open. That reduces the chance of a Bear Trend From The Open.
- The bulls want a Bull Trend From The Open, but what usually happens after a big gap up or down is the market enters a trading range for an hour or two. Once it gets near the EMA, the bulls will try to rally from a double bottom or wedge bottom within the range. The bears will try to resume the bear trend from a double top or wedge top near the EMA.
- Weak sell signal bar yesterday on daily chart, but context is good for the bears (micro double top, expanding triangle, top of bull channel).
- Because today is the last day of the week and of the month, weekly and monthly support and resistance can be important, especially in the final hour.
- The most important weekly magnets are the open of the week and last week’s high. The bulls want a bull bar and a close above last week’s high. That would increase the chance of at least slightly higher prices next week.
- Today will probably gap below the open of the week. If this week has a bear body, it will increase the chance of at least slightly lower prices next week.
- The bigger the bear body and the more the week closes on its low, the more likely next week will trade below this week’s low.
- There is no nearby monthly support or resistance. The open of the month is more than 100 points below and therefore very unlikely to be a factor.
Yesterday’s Emini setups

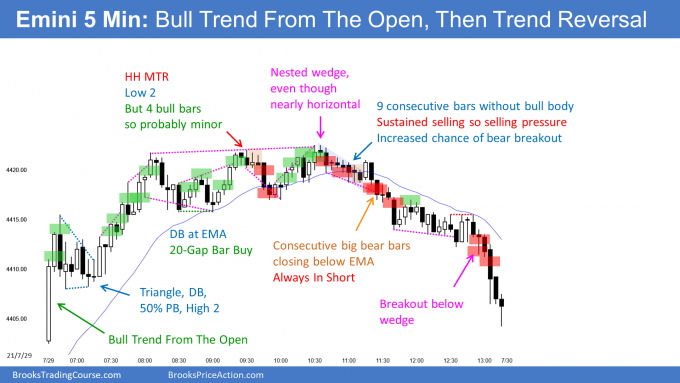
Here are several reasonable stop entry setups from yesterday. I show each buy entry with a green rectangle and each sell entry with a red rectangle. Buyers of both the Brooks Trading Course and Encyclopedia of Chart Patterns have access to a much more detailed explanation of the swing trades for each day (see Online Course/BTC Daily Setups).
My goal with these charts is to present an Always In perspective. If a trader was trying to be Always In or nearly Always In a position all day, and he was not currently in the market, these entries would be logical times for him to enter. These therefore are swing entries.
It is important to understand that most swing setups do not lead to swing trades. As soon as traders are disappointed, many exit. Those who exit prefer to get out with a small profit (scalp), but often have to exit with a small loss.
If the risk is too big for your account, you should wait for trades with less risk or trade an alternative market like the Micro Emini.
EURUSD Forex market trading strategies
EURUSD Forex daily chart

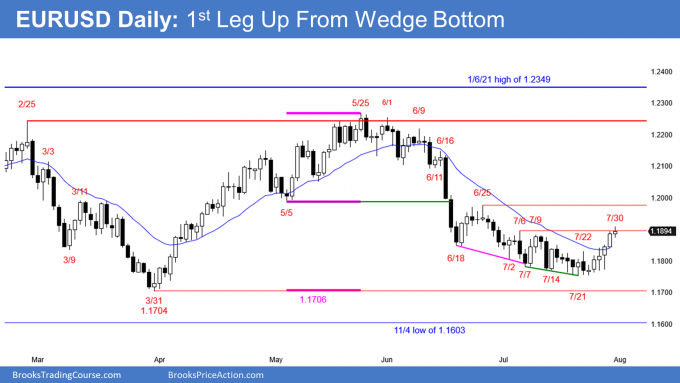
- 5 consecutive bull bars after consecutive wedge bottoms, which is a high probability buy setup.
- Testing the July 6 and July 9 double top so might pull back for a couple days.
- Traders expect the pullback to form a higher low. They then will look for a 2nd leg up.
- If the rally breaks above that double top, the next target is the June 25 lower high.
- After 9 bars in a bear micro channel on the weekly chart (not shown), this rally will probably not last more than a another week or two before pulling back. However, the odds favor sideways to up trading for at least a couple weeks.
- Today is the last trading day of the week and of the month. Weekly and monthly support and resistance can be important, especially in the final hour.
- The bulls want the week to close above last week’s high, which is likely.
- The more the week and month close on their highs, the more likely traders will see higher prices next week and next month.
Summary of today’s S&P Emini futures price action and what to expect tomorrow

End of day summary
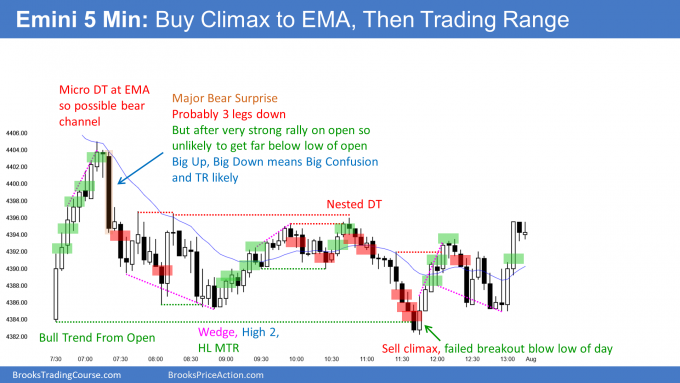
- Strong rally on the open up to the resistance of the 60 minute EMA, the open of the week, the 4,400 Big Round Number, and the Globex high.
- Sold off and entered a trading range.
- The strong early rally made a bear trend unlikely.
- The trading range had lower highs and it was also a bear channel.
See the weekly update for a discussion of the price action on the weekly chart and for what to expect going into next week.
Trading Room
Traders can see the end of the day bar-by-bar price action report by signing up for free at BrooksPriceAction.com. I talk about the detailed S&P Emini futures price action real-time throughout the day in the BrooksPriceAction.com trading room. We offer a 2 day free trial.
Charts use Pacific Time
When I mention time, it is USA Pacific Time. The Emini day session charts begin at 6:30 am PT and end at 1:15 pm PT which is 15 minutes after the NYSE closes. You can read background information on the market reports on the Market Update page.

