5 percent correction after Trump impeachment talks
Updated 6:52 a.m.
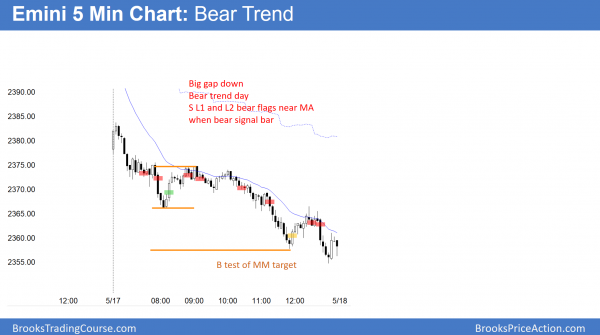
The Emini began with a big gap down to the bottom of the 3 week wedge rally. Yet, the 1st 2 bars were bull bars and the 1st one was strong. This therefore creates confusion. Hence, a trading range for the 1st hour or so is likely.
In addition, the Emini is far below the moving average. When that happens, the Emini usually goes sideways to up to the moving average for about an hour. The bulls try to get a reversal up, but the bears try for a Low 2 or wedge bear flag. Unless the bulls get a strong reversal up, the bear flag is more likely.
Because the bulls have not reversed up strongly and relentlessly on the open, the odds favor a bear trend day or a trading range day.
Pre-Open market analysis
The Emini reversed down from another new all-time high yesterday. Yet it reversed back up and became a trading range day. Because the bull channel over the past 4 weeks now has 3 pushes up, it is a wedge top. Since it is above the March 1 high, it is a wedge higher high major trend reversal. Yesterday’s bear body therefore made yesterday a sell signal bar.
However, since the bull trend is strong, most reversals fail. Furthermore, major tops have a 40% chance of leading to a swing down. In addition, there is another way to draw the wedge channel where the top of the channel is about 5 – 10 points above yesterday’s high. Also, AMZN and GOOGL are in strong rallies and within 40 points of the 1,000 Big Round Number. The market might be waiting for one or both to hit 1,000 before correcting.
Hence, while the weekly chart has an extreme buy climax and a 1 – 2 month pullback is likely soon, the odds that yesterday is the top are less than 40%. Therefore, bears wanting a higher probability of a swing down need to wait for one or more big bear bars, or 3 or more consecutive small bear bars. This can happen anytime within the next couple of weeks.
Overnight Emini Globex trading
The Emini is down 14 points in the Globex market. It will therefore probably gap down. Hence, the gap will form a 4 week island top with the April 25 gap up and a 2 day island top with Monday’s gap up. Island tops and gaps are common in trading ranges and usually do not have predictive value. However, this gap down is coming after an extreme buy climax on the weekly chart. For the past several weeks, I have been saying that there was a 70% chance of a 100 point correction beginning within a few weeks. Today’s gap down therefore has an increased chance to be the start of a swing down on the daily chart. Traders should look for signs of a bear trend day.
In addition, if today is even just a weak bear trend day, traders should be ready for a surprisingly strong selloff in the last hour. If this is the start of a swing down on the daily chart, there will be an increased chance of late selloffs every day. This is more common in bear trends. Hence, traders need to be prepared for a possible evolution of the trading range trading of the past 2 months into bear trend trading.
The bigger the gap, the more likely it will have follow-through over the following days. If today is a big bear trend day closing on its low, the odds of follow-through selling also will be greater. Since the Emini has been sideways for 2 months, the odds are that the bears will be disappointed about something over the next few days. For example, today might be a bull doji day instead of a big bear trend day.
Bull case is less likely
Finally, the daily and weekly charts are in strong bull trends. Consequently, many traders will buy every reversal down. Hence, it is possible that the bulls buy the gap down and today could be a bull trend day that closes above yesterday’s low. Consequently, if a strong rally begins, traders should be prepared to swing trade from the long side. Yet, because of the weekly buy climax, this is less likely today.
EURUSD Forex market trading strategies
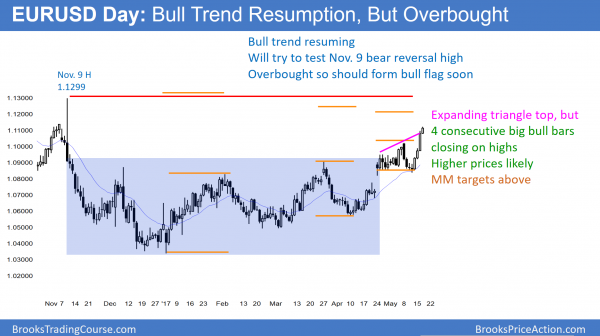
The EURUSD daily chart’s bull breakout continues. The next target is the November 9 top of the sell climax.
Today is the 4th consecutive day of a strong bull breakout above a 6 month trading range. There are several measured move targets just above. The most important target is the November 9 major high. This is because it is the start of a 2 month strong bear trend. Therefore, the final bears will give up above its high.
But, as strong as this 5 month rally has been, it is still simply a leg in a 2 year trading range. Furthermore, there is no sign that the EURUSD is about to break out of the range. Finally, this rally has only climbed a little above the midpoint of the range. Hence, this is still a bull leg in a 2 year trading range.
Overnight EURUSD Forex trading
While today is the 4th bull trend bar on the daily chart, today’s bar is smaller. Additionally, the the 240 minute chart has been sideways for about 24 hours. Since the rally has been unusually big, bulls will take partial profits. This is because their stop is below the 4 day rally, which is far below. It does not matter when they bought over the past 4 days.
All of these bulls now have the same logical stop. Since it is far, their risk is big. The easiest way to reduce risk is by reducing the size of their position. That profit taking causes the rally to stall and form a bull flag. Once they decide that the pullback will not likely fall much further, they will buy again. That pullback will then be a bull flag. If there is then a strong bull breakout, the bulls will raise their stops to below the bull flag low.
The 4 day rally covered about 300 pips. Because the pullbacks were small in the 5 minute chart, the bulls are eager to buy. Consequently, if a bull flag forms over the next couple of days, it probably will not be deep. In addition, it will probably not last too long.
Therefore, instead of a 50% correction, the 1st pullback might only be about 35%, or about 100 pips. Furthermore, it will probably last only 2 – 3 days. The odds of a reversal down without at least a micro double top on the daily chart are small.
Summary of today’s S&P Emini futures price action and what to expect tomorrow
The Emini had a big gap down and then a bear channel. Just before noon, it reversed up from a measured move down from a double top bear flag.
Today was a big bear trend day. By falling below last week’s low, it created an outside down bar on the weekly chart. Furthermore, that triggered a weekly sell signal.
Since the weekly chart is so overbought, there is a 60% chance that today is the start of a move to below the weekly moving average. But, when there is a big gap at the start of a trend, the Emini often goes sideways for a few days before the bear trend resumes.
See the weekly update for a discussion of the price action on the weekly candlestick chart and for what to expect going into next week.
Traders can see the end of the day bar-by-bar price action report by signing up for free at BrooksPriceAction.com. I talk about the detailed S&P Emini futures price action real-time throughout the day in the BrooksPriceAction.com trading room. We offer a 2 day free trial.
When I mention time, it is USA Pacific Standard Time (the Emini day session opens at 6:30 am PST, and closes at 1:15 pm PST). You can read background information on the intraday market reports on the Intraday Market Update page.


