Monthly S&P500 Emini futures candlestick chart:
Continued pullback after buy climax
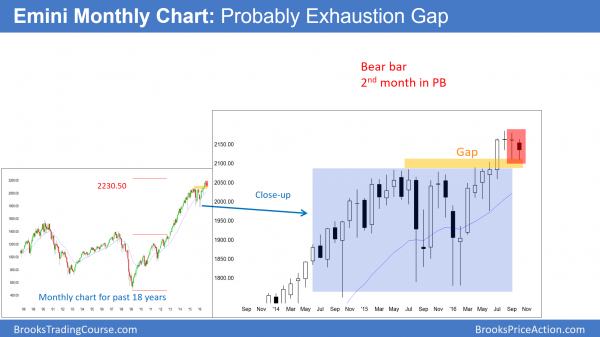
The monthly S&P500 Emini futures candlestick chart has a small bear body after 2 dojis. This is weak follow-through buying after the July breakout above a 2 year trading range.
The monthly S&P500 Emini futures candlestick chart has a bear doji so far this month. Because it traded below last month’s low, it is now the 2nd month of the pullback. Yet, without a strong reversal down, the odds are that bulls will buy the pullback.
Buy climax
The monthly chart had 7 consecutive bull bodies through August. Since that is unusual, it is climactic. Each time it happened in the 18 year history of the Emini, it led to about a 100 point correction over the next few months. Therefore the odds favor more selling.
Exhaustion Gap more likely than Measuring Gap
Furthermore, the gap above the July 2015 is still open. When a gap forms more than 20 bars into a trend, the odds are it will close. This gap is about 100 bars into the bull trend. The odds are 70% that it will close before the Emini goes much above the old high. What traders do not yet know is if the gap will close over the next few weeks, or after a new high. There is a 60% chance that it will close over the next few weeks.
Weekly S&P500 Emini futures candlestick chart:
Doji ioi above moving average so Presidential election stock market rally or reversal
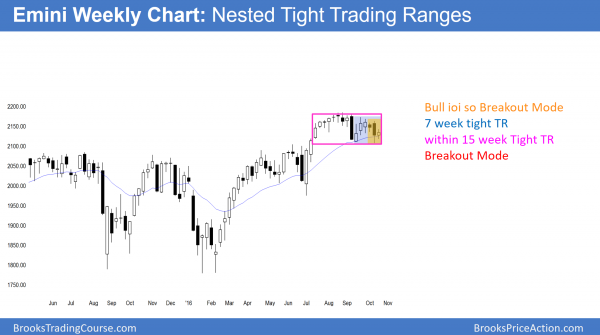
The weekly S&P500 Emini futures candlestick chart formed a bull doji inside bar this week. Because last week was an outside bar, this is an ioi Breakout Mode pattern.
The weekly S&P500 Emini futures candlestick chart formed a small doji inside bar this week. It is therefore neutral. In addition, it has been in a tight trading range for 7 weeks. This is a further sign of the neutrality.
The bulls see this week as a buy signal bar for a double bottom bull flag. They will therefore buy next week if next week goes above this week’s high.
The bears see this week as a pullback from last week’s bear breakout. They will therefore sell below this week’s low.
While both the bulls and bears are correct, the tight trading range lowers the probability of their trades. A tight trading range is a limit order market. Therefore the odds are that there are sellers above and buyers below. Hence, the Emini is more likely to remain within the tight trading range.
Wedge rally or lower high?
If the bulls rally above this 7 week double bottom bull flag, they would probably reach a new high. Yet, that high would be the 3rd push up. Bears would therefore sell a reversal down from the wedge top. Furthermore, the 2 year trading range broke below the 7 year bull channel. Therefore, traders would see the reversal down as a Final Flag Top and a Higher High Major Trend Reversal. Most major reversals go sideways. Only 40% lead to an actual opposite swing. Yet, traders need to be ready because the reversal down can be fast, and therefore easy to miss.
Daily S&P500 Emini futures candlestick chart:
8 day tight trading range
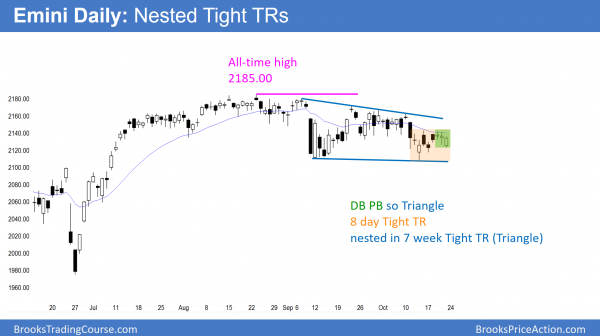
The daily S&P500 Emini futures candlestick chart has been in a tight trading range below the moving average for 8 days. It is therefore in Breakout Mode.
The daily S&P500 Emini futures candlestick chart is still in its 8 day tight trading range. Hence, there is a 50% chance of a bull breakout or a bear breakout. Furthermore, there is a 50% chance that the 1st breakout will fail and lead to a breakout in the opposite direction.
Trading ranges always have both credible buy and sell setups. While the bears see a Micro Double Top, the bulls see a Micro Double Bottom. Friday closed on its high. It is therefore a buy signal bar for Monday. Yet, the probability of a breakout is still low. The bulls need a strong break above the moving average and the double top at the top of the 8 day range. Otherwise, the trading range will continue.
Traders can see the end of the day bar-by-bar price action report by signing up for free at BrooksPriceAction.com. I talk about the detailed Emini price action real-time throughout the day in the BrooksPriceAction.com trading room. We offer a 2 day free trial.
When I mention time, it is USA Pacific Standard Time (the Emini day session opens at 6:30 am PST, and closes at 1:15 pm PST). You can read background information on the intraday market reports on the Intraday Market Update page.


