Market Overview: Nifty 50 Futures
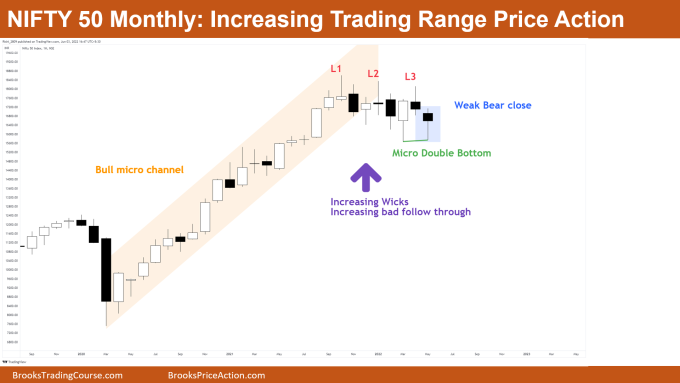
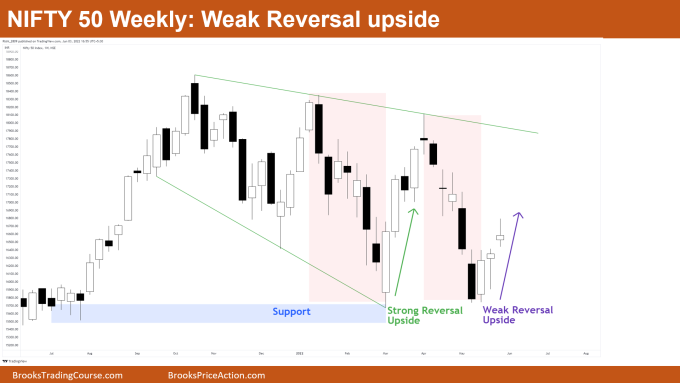
The Nifty 50 futures after giving a breakdown of bull micro channel on monthly chart now showing increasing trading range price action, and also forming micro double bottom after a Low 3. Nifty 50 on the weekly chart came to support area but weak reversal up without bull strength, which was clearly seen in the last move up (shown in green text) and missing in the current leg up.
Nifty 50 futures
The Monthly Nifty 50 chart

- General Discussion
- This month gave a bad bear close, also having very big tail on the bottom which is clearly not very bearish.
- This was the 3rd attempt by the bears to go down (i.e., Low 3 which is also a wedge).
- All 3 attempts by bears found to be very weak so the maximum bears expect to get is a trading range after the bull micro channel breakdown.
- Deeper into the price action
- Whenever you see increasing tails in the candles, this means that bulls are buying the low of the bars and bears are shorting the high of the bars.
- This means that this is a limit order market which thus means that market is slowly converting into trading range.
- When you see this kind of behavior in the price action of any chart, you should be avoiding entering with stop orders above or below the bars.
- Patterns
- A clearly seen Low 3 which tells us that market is in a wedge. Always remember market would not form perfect lines and perfect patterns so you have to make a habit of seeing price action patterns fundamentally which Dr Brooks teaches us in the course.
- This month’s candle also forming micro double bottom, which is a bullish sign, but bulls know market is in trading range thus they would be looking to take quick profits.
- Pro Tip
- Whenever you take any reversal entries you have to keep note of few things
- Strength of Reversal Attempt: – You need to look upon how strong the reversal attempt was. Let’s take an example of above chart, as you can see that market was in strong bull trend with minimum pullbacks. This means that market has to form strong consecutive bear bars to reverse this kind of market. Are you able to see this in the above chart? No!
- Number of Bars in Reversal Attempt: – Look at the bars on the left. How big is the trend? How many bars does this bull trend have? If the bull trend has many bars, then you need a greater number of bear bars to reverse the market, and vice versa.
- Whenever you take any reversal entries you have to keep note of few things
The Weekly Nifty 50 chart

- General Discussion
- Market gave a bad bull bar this week with a big tail on the upside.
- After sharp bear leg the reversal attempt is very weak.
- Market near 50% level of the last bear leg down.
- As reversal is weak you can expect one more small leg downside before resumption upside.
- Deeper into price action
- If looking at bars on the left you would notice that the last leg upside was very strong (green text) which led to top of the expanding triangle.
- As we already discussed above, the stronger the bull trend the stronger the bear bars you need to cause the reversal. Similarly in the above image, the move down was quite strong but the reversal attempt is not strong with lots of tails and trading range price action.
- Therefore, the maximum bulls can expect would be one more leg down or a trading range.
- Patterns
- Market near bottom of the expanding triangle and weak reversal up seen, thus probably at least a small trading range.
- In the expanding triangle this was the 3rd climatic bear leg down, so this can be the possible end of this expanding triangle. Market can soon resume higher time frame trend towards upside, or at least convert into trading range.
Market analysis reports archive
You can access all weekend reports on the Market Analysis page.

