Market Overview: Nifty 50 Futures
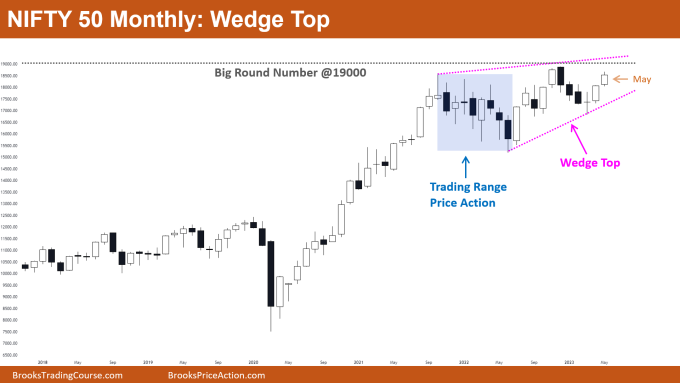
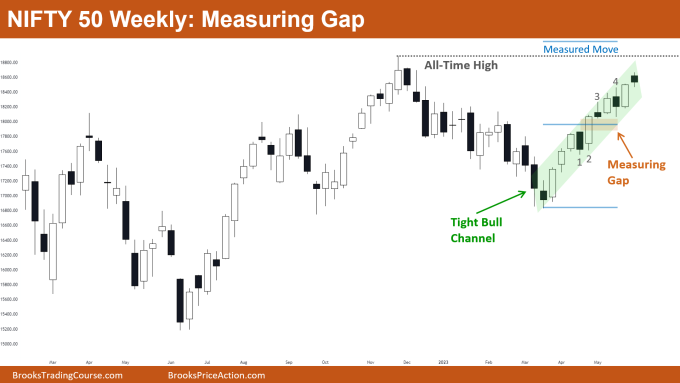
Nifty 50 wedge top on monthly chart where Nifty 50 produced a series of bull closes, but the bull bar has a small body. Market is getting close to the big round number and the all-time high level, which will act as powerful price resistance. The market is trading inside a tight bull channel, and the Nifty 50 produced a bearish close on the weekly chart.
Nifty 50 futures
The Monthly Nifty 50 chart

- General Discussion
- More bears would be drawn in as the market approached the peak of the wedge top formation and the all-time high level, both of which serve as price resistance.
- The market is close to the wedge top, thus bulls should refrain from purchasing at this price.
- Bulls who are in long position should not exit their positions until market reaches the all-time high or forms a strong bear bar.
- Bears should hold off on selling until the price has reached the closest resistance and the market has formed a strong bear bar.
- Deeper into the price action
- Observe the last 20 bars on the monthly chart. You’ll see that the majority of them overlap and have small bodies and tails on either side.
- Because these characteristics of trading range price behaviour are present, a trading range is likely to arise.
- A trading range would result if bulls are unable to successfully break out of the 19000 level.
- Patterns
- A wedge can be thought of as a channel, thus a trading range would be the next potential phase according to the market cycle theory.
- Since 19000 is a big, round number and would act as a magnet, this could result in a sharp bull leg in that direction in shorter time frames.
The Weekly Nifty 50 chart

- General Discussion
- Market is trading inside a tight bull channel and thus bears should wait for a strong bear close before they sell.
- Bulls should refrain from taking a swing position at this level as the market is getting close to an all-time high.
- Because there is a pending measured move target, bulls who are long should only exit their position when the market develops strong bear bars, or close to the measured move target.
- Deeper into price action
- In the last 10 to 15 bars, bulls were able to give strong successive bull closes while bears were unable to create a strong bear bar.
- Bulls gave a strong breakout of the bar-1 high, leading to an open breakout gap, despite the fact that Bar-1 was a solid bear bar.
- Bears attempted to close the breakout gap on bar-3 but were unable.
- Bears made another attempt to close the breakout gap on bar-4 but were unsuccessful. The strong bull bar that followed suggested a potential measuring gap.
- Patterns
- Because the market is now trading within a narrow bull channel, bulls shouldn’t take a swing position and bears shouldn’t sell until the market produces a significant bear bar.
- The market created a measuring gap, which gave the bulls who are already long a potential target to target a measured move.
- Because the market is currently trading close to its all-time high, traders should be prepared for some trading range price action in the upcoming weeks.
Market analysis reports archive
You can access all weekend reports on the Market Analysis page.

