Market Overview: Nifty 50 Futures
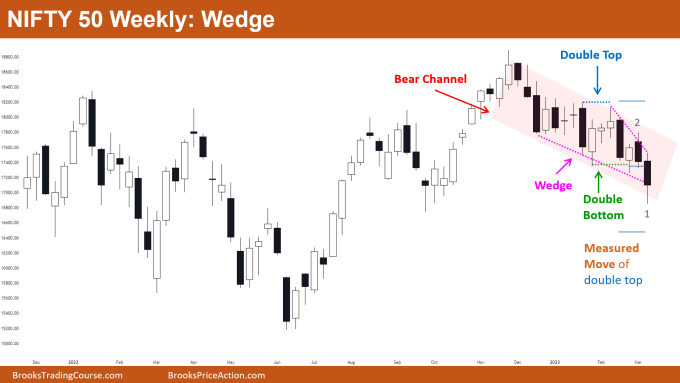
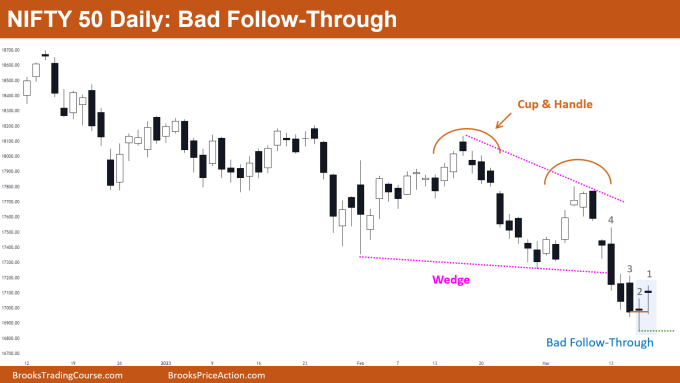
Nifty 50 wedge on the weekly chart, due to the long wick at the bottom of the candle, bears may not be interested to sell next week. The daily chart of the Nifty 50 showed a bear breakout of the wedge, but it appears that few bears anticipated the move, which led to poor follow-through. However, given the strength of the breakout, bears would anticipate at least a small second leg down.
Nifty 50 futures
The Weekly Nifty 50 chart

- General Discussion
- Some bears would sell at the low of bar 1 and target the measured move down of the double top pattern.
- Bulls would not be buying at or above the bar 1, instead they would prefer to wait for a bull close and then consider buying.
- Some bears might sell with a limit order at the high of bar 1, but since there are fewer chances of a successful bear breakout of the wedge, they would take into account a risk-to-reward ratio of at least 1:2.
- Deeper into the price action
- Since we are distinctively trading inside a bear channel, bulls should always look to book quick profits as this is a bear channel (and a bear trend on a shorter time frame).
- This is due to the fact that against the trend legs are typically shorter and end sooner than anticipated, which frequently forces traders to give up profits.
- Until there is a sign of reversal, which can be a reversal pattern or a strong leg against the trend, bears should continue to hold their positions.
- Patterns
- Many bears shorted at the low of bar 2, which may have occurred for the reasons listed below:
- Bear bar 2 closed at it’s low, which attracted some bears to short below it.
- Market was in breakout mode, and bulls were not successful in driving the market higher after the double bottom attempt.
- There was an measured move down pending the double top (blue dotted line).
- The market attempted to break out of the bear channel, but it is still trading there. Because the market is still in the channel, traders should trade it as a channel, meaning that if bulls are buying, they should book profits and bears should hold their positions (i.e. swing their trade).
- Many bears shorted at the low of bar 2, which may have occurred for the reasons listed below:
The Daily Nifty 50 chart

- General Discussion
- The market made a strong bear leg breakout, which will entice some bears to sell at the Low 1 or Low 2 for a subsequent leg down.
- Bulls may buy after the formation of a strong bull bar for a scalp if bears do not get any follow-through.
- Deeper into price action
- Because bar 3 was a strong bear bar closing near its low, many traders would have shorted at the low of bar 3 in anticipation of the bear breakout of the cup & handle pattern.
- The tail at the bottom of bar 1 suggests that bears who shorted the close of bar 3 exited on breakeven, which would disappoint bears who shorted at that point due to the poor follow-through.
- Bears seeking to exit their positions at breakeven who were unable to do so would look to scale in on the following Low 1 sell signal bar.
- Patterns
- The market typically forms a second leg down after a significant bear leg for a number of reasons:
- If the pullback after the strong bear leg was weak then confident bears would scale in their positions to anticipate the trend.
- If the pullback after the strong bear leg was strong then disappointed bears would look scale in their position for exiting their positions at breakeven.
- The market typically forms a second leg down after a significant bear leg for a number of reasons:
Market analysis reports archive
You can access all weekend reports on the Market Analysis page.

