Market Overview: Nifty 50 Futures
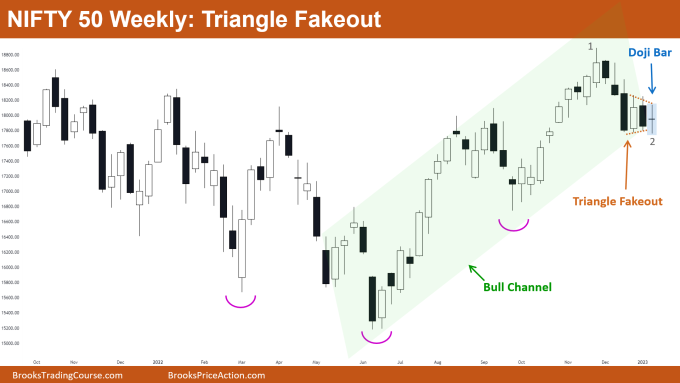
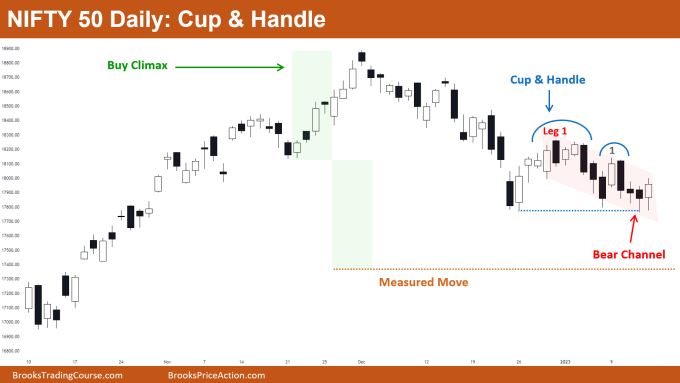
Nifty 50 triangle fakeout on the weekly chart. Last week’s market formed inside bar on the weekly chart which is a triangle pattern on smaller time frame charts. The market is trading near the bottom of the bull channel. Nifty 50 on the daily chart formed a cup & handle pattern, but the bear breakout attempt was weak and did not get any follow-through down.
Nifty 50 futures
The Weekly Nifty 50 chart

- General Discussion
- The market is in a bull trend and currently trading at bottom of the bull channel which makes it harder for bears to sell and make profits.
- Conservative bulls would be buying above strong bull bars (and ride the next bull leg). Aggressive traders would be buying below strong bull bars (with limit order) or even above weak bear or bull bars.
- As the market has formed a Doji bar, traders generally prefer to wait for the next bar and then enter on either side for improving the odds of success.
- Deeper into the price action
- The previous week’s market formed an inside bar (which is a sign of indecision) and now the market formed a Doji bar. This implies that traders should be waiting until the market forms a decisive bar (bar with a big body and minimum tail).
- The bear leg (from bar 1 to bar 2) is strong which decreases the probability of another strong bull leg, rather it increases the chances of the market converting into a small trading range.
- Observe the four bear bars in the bear leg (bar 1 to bar 2), all of them are closing near their lows which decreases the chances of the market continuing up with the same strength as it did before.
- Patterns
- As bears failed to give a successful bear breakout of the triangle pattern and bull channel, some bulls would be placing limit orders to buy at the low of bar 1 (assuming that bears would again fail).
- Whenever you see an inside bar or inside-inside bar on the higher time frame, this means on some lower time frame market is forming a triangle pattern.
- Pro Tip
- You should have the correct risk-to-reward ratio for getting a positive trader’s equation. What do I mean by “correct”?
- You should be choosing the risk-to-reward ratio for any particular trade based on the type of pattern you are trading.
- Case 1: If you are trading a triangle pattern that has nearly 50-50 chances of success, it does not make sense to trade with a 1:1 risk-to-reward ratio.
- Case 2: If you are planning to buy near the bottom of the bull channel then the probability of the trend continuing is nearly 60%, so having a risk to reward greater than or equal to 1:1 is valid.
- Case 3: If you are planning to buy a wedge bottom breakout (which is a reversal trade) then the probability of a successful reversal is nearly 40%, so you should be maintaining around 1:2 risk to reward in these types of trade.
The Daily Nifty 50 chart

- General Discussion
- Nifty 50 is in a bear trend on the daily chart, and also formed a cup & handle pattern which did not get any follow-through down on the bear breakout attempt.
- Bulls would avoid buying until they see strong consecutive bull bars. The best bulls can get for now is the trading range (as the market is in a strong bear trend).
- Bears were unable to give bear breakout of the cup & handle pattern but are still in a bear channel. This will attract some bears to sell near the top of the bear channel.
- Deeper into price action
- Bull leg 1 (marked with red color) was a strong reversal attempt by the bulls to reverse this bear trend.
- We can see the market formed tails below recent bars which means many bulls bought with limit orders at the bottom of leg 1 (see blue dotted line).
- To reverse this bear trend, bulls need strong consecutive bull bars closing near highs, if not then the best bulls would get is a small trading range.
- The measured move of buy climax (brown dotted line) would be acting as a strong magnet – if the next bar the market forms are a strong bear bar closing near its low.
- Patterns
- The market is in a strong bear trend and forming a cup & a handle pattern.
- The last three bars have tails below attracting more bears to sell the market. Bears need to form a bear bar closing near their low.
- If bulls can move the market above the high of bar 1, it would be extremely unlikely for bears to pick up the bear trend again.
Market analysis reports archive
You can access all weekend reports on the Market Analysis page.

