Market Overview: Nifty 50 Futures
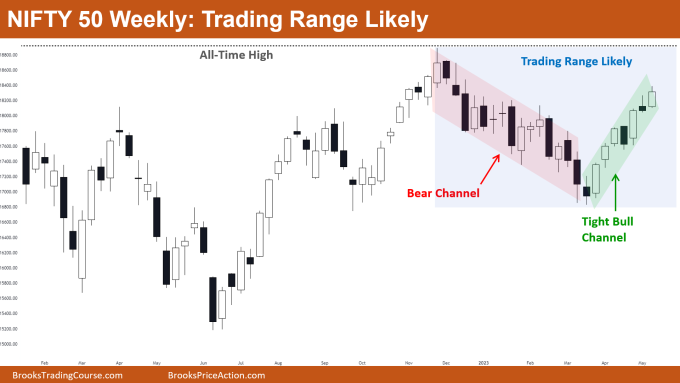
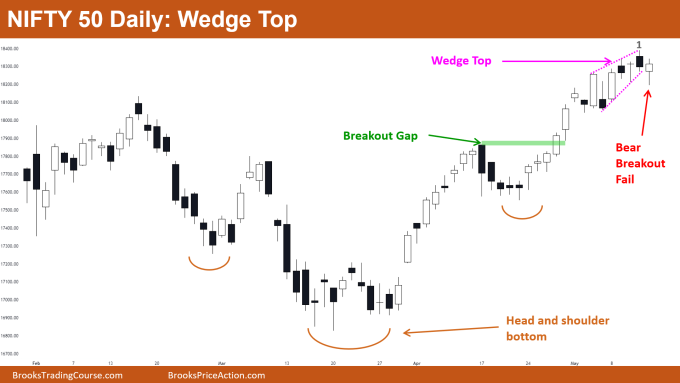
Nifty 50 trading range most likely. This week’s market produced a bullish close; but, the bull bar’s small body and short top tail indicate that a small pullback is likely. On the weekly chart, the Nifty 50 is still trading inside the tight bull channel. The market recently has not created any significant bear bars, therefore bears should avoid selling and bulls should buy pullbacks using high-1 and high-2 setups. The Nifty 50 on the daily chart gave a fake bear breakout of the wedge top.
Nifty 50 futures
The Weekly Nifty 50 chart

- General Discussion
- Because the market is trading inside of a tight bull channel, bears would (should) hold off on selling until the market at least gives a strong bear bar that closes near its low.
- The chances of a bullish breakout to an all-time high are decreasing as the market approaches the top of a potential trading range, thus bulls will soon start taking profits on their long positions.
- Some bulls may use limit orders to enter their long positions because the market is in a strong bull channel but also close to the high of a potential trading range.
- Deeper into the price action
- Bears were only able to create one strong bear bar in the previous ten bars that closed near the bottom; however, even that strong bear bar was unable to persuade many bears to sell the market, failing to produce any follow-through down.
- Bars within the tight bull channel are closing near their highs, and the tails of these bars did not trade significantly below the previous bar’s high.
- This is a sign that bulls kept buying all the way up and now market is approaching all-time high which acts as a strong resistance for the price.
- As the market gets closer to its all-time high, the bulls who are holding long positions would start to sell them.
- Patterns
- As the market nears its all-time high (a level of resistance), bulls would seek exits, and bears would seek short entry on strong bear bars.
- In the present situation, bears could enter short in a variety of ways:
- Short at the bottom of bear bars with a strong low-1 or low-2. (Entry approach that is aggressive)
- Short at the low of a strong bear bar that closed close to its low.
- Short the market once consecutive bearish bars have formed. (conservative entry style)
The Daily Nifty 50 chart

- General Discussion
- Because of the market’s strong bull trend, bears should hold off on selling until they have made at least one double top to turn the market around.
- Bulls may buy on breakouts or enter at high-1 or high-2 bars, and place their stop at the nearest swing low.
- Bears would need at least a double top pattern or strong consecutive bear bars in order to reverse this strong bull trend.
- In strong bull trends, small wedge tops and weak reversal attempts fail to convince bears to sell the market, which typically leads to failed reversal attempts.
- Deeper into price action
- Before any kind of reversal, bulls ought to expect a brief leg up because bears who shorted at the low of bar-1 are trapped and would likely exit their short positions, which could lead to a brief leg up.
- Bulls would buy on high-1 (at the top of the hammer bar) knowing that some bears have been trapped and that the bear breakout did not convince bears to short the market.
- Patterns
- Market has formed a breakout gap and has broken out of the head and shoulders bottom pattern, which is an excellent sign for the bulls.
- Market showed a bearish breakout of the wedge top, but the breakout was unsuccessful since the bears were unable to create strong bear follow-through bars.
Market analysis reports archive
You can access all weekend reports on the Market Analysis page.

