Market Overview: Nifty 50 Futures
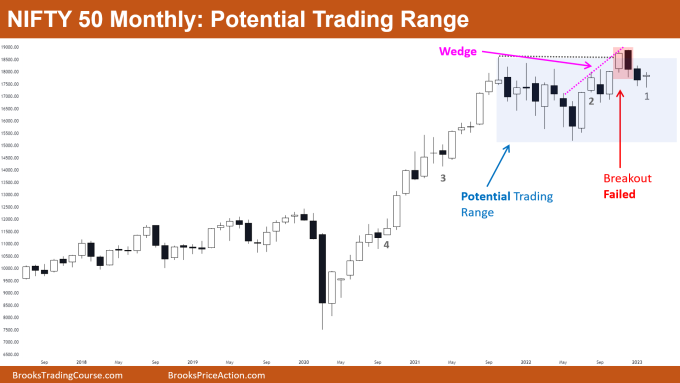
Nifty 50 potential trading range on the monthly chart, the market formed a small bull bar after two consecutive bear bars. Here, bulls would be trying to breach the all-time high and bears would be willing to sell for Low 2 after the fake bull breakout.
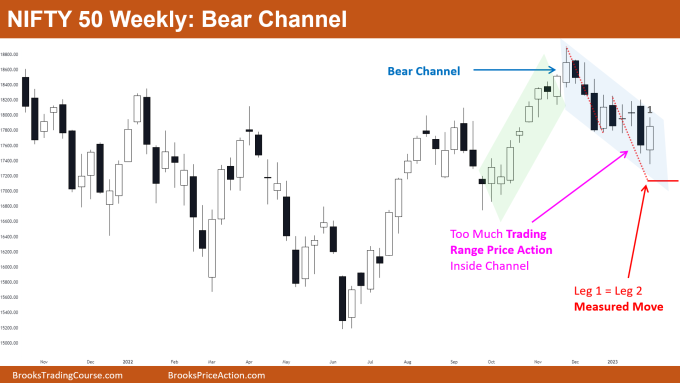
On the weekly chart, the market formed a strong bull bar this week and is currently trading inside the bear channel. The overall price action inside the bear channel is trading range price action.
Nifty 50 futures
The Monthly Nifty 50 chart

- General Discussion
- The two consecutive bear bars show that many bears sold near the wedge top, but until now they haven’t received any follow-through down for a potential reversal.
- Some bears would be selling above the high of bar-1 as the market generally forms 2nd leg down after a fake bull breakout. But conservative bears may prefer selling below a bear bar which may form after bar-1.
- Bulls would be buying above the bar-1, or some bulls may buy if the market forms another bull bar. In either scenario, bulls must exit if the market begins to reverse again (downward).
- Deeper into the price action
- Look at the bars on the left of bar-1, specifically inside the trading range. Bars are having tails above and below and the last bull leg was quite steep and unsustainable (especially after a long bull trend).
- These factors increase the chances of a trading range rather than a resumption of the bull trend.
- Bar-1 is a very small bar relative to the bars on the left, so not many bulls would buy above bar-1. Rather many bulls would prefer to wait for one more bull bar.
- Patterns
- If bulls do not get any follow-through above the bar-1 then the market can convert into a trading range (shown in the blue box).
- The market has also formed a wedge on the monthly chart, so this would attract some more bears which improves the odds of a trading range.
- Pro Tip
- When there has been a lot of trading range price action recently in the market then avoid buying or selling above or below a small bar.
- But why? You need to understand that a small bar is a trading range on the smaller time frame, and we know the odds of a successful breakout are 50-50.
- Therefore, placing a trade on a small bar reduces the likelihood that the market will move in the direction you anticipate when there has recently been a lot of trading range price action.
- Note: This is not the same in the case of a trending market, as shown by bar 4 and bar 3 which are small bars but are occurring in a trending market, which makes it reasonable to buy above them.
The Weekly Nifty 50 chart

- General Discussion
- There has been a lot of trading range price action recently in the bear channel, which means this would be a broad bear channel on a smaller time frame.
- This week the market formed a bull bar closing near the high, but the bull bar closed near the top of the channel, which makes it difficult for the bulls to buy above its high.
- Some bears would sell above bar-1 as the market is near the top of the bear channel and the measured move (leg1 = leg2) would be acting as a magnet.
- Deeper into price action
- There is a lot of trading range price action in the bars to the left of bar-1, this suggests that the chances of trading range are higher rather than a trend.
- If bulls manage to get another bull bar closing near its high then the bears who are waiting for the measured move target to book their profits would be trapped and would this drive the prices higher.
- Patterns
- The market formed a tight bull channel (green box) and then formed a bear channel, this implies that bears and bulls are selling high and buying low.
- Whenever the market forms this kind of pattern then the chances of a trading range are always higher than a trend.
- After this kind of price action both bulls no longer trade the market like a trending market rather they start buying low and selling high, i.e., they trade like a trading range.
Market analysis reports archive
You can access all weekend reports on the Market Analysis page.

