Market Overview: Nifty 50 Futures
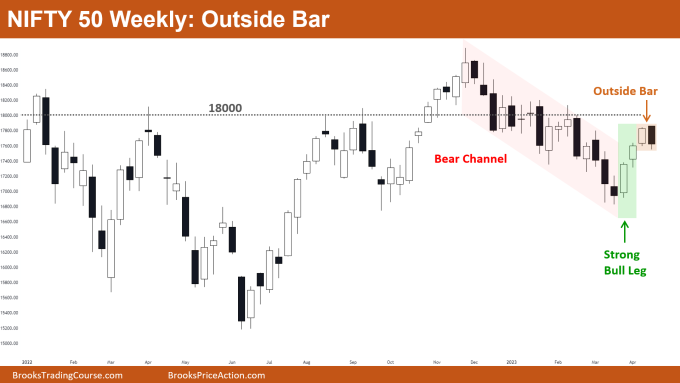
Nifty 50 outside bar on the weekly chart. The weekly chart of the market shows a bearish closing for this week. The bear bar has a short tail at the bottom, which may cause some bears to sell, especially following a powerful bull leg that broke out of the bear channel.
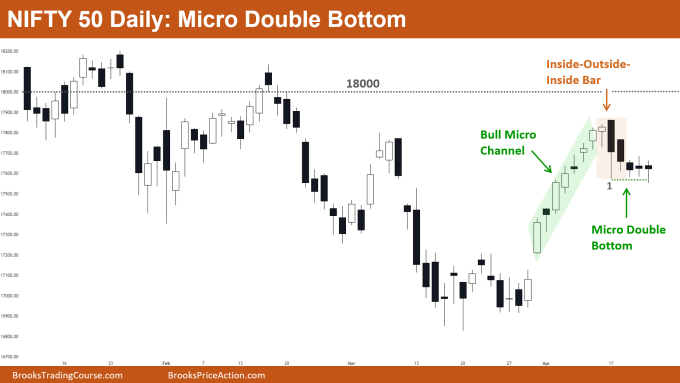
This week, the market’s daily chart broke below the bull micro channel. The last few bars on the daily chart have tails on either side, and the bear bar bodies are getting smaller, which may point to a potential second leg up.
Nifty 50 futures
The Weekly Nifty 50 chart

- General Discussion
- Some bears may sell at the outside bar’s low in an attempt to prevent the breakout and turn this powerful bull leg into a trading range.
- Because the bull leg is quite strong and the market may show a second leg up, selling at the low of the outside bar would be a low probability trade. Bears who would do this would need to have a favourable risk to reward ratio.
- Given the strength of the bull leg, some bulls may desire to place limit orders at the low of the outside bar in anticipation of the second leg up.
- Conservative bulls would wait for a bull close and then buy at or above the high of that bull bar.
- Deeper into the price action
- Bulls frequently place limit orders to buy at the lows of bull bars during a strong bull leg (such to the one seen above in the figure using a green box).
- The tail at the bottom of the outside bar may be the result of numerous bulls placing limit orders near the bottom of the bull bar.
- Bulls set limit orders to purchase at the bottom of bull bars during strong bull legs because they understand that the likelihood of a second leg up is higher than the likelihood of a fast reversal down (bear leg), making a trade like this reasonable.
- Patterns
- Following a strong bull leg, the market formed an outside bar. If bears are able to build another strong bear bar, the bulls who purchased at the low of the bull bar will be trapped.
- A “2nd leg trap” occurs when bulls buy in anticipation of the market’s second leg up, but the market actually reverses down rather than rising.
The Daily Nifty 50 chart

- General Discussion
- The market made a bear breakout of the bull micro channel, and it has since created 5 straight bear bars, which may have some bears considering selling the market.
- Bulls would wait for a strong bull close before buying at or above the high because they can see the micro double bottom.
- Both bulls and bears would like to wait for a good close before entering any trades due to increasing tails and patterns like inside-outside-inside bars, which signal increasing trading range price action.
- Deeper into price action
- The bar’s long tail at the bottom indicates that a number of buy limit orders were triggered by the market, suggesting that bulls may have placed these orders in anticipation of a second leg up.
- Indicators of sideways price action in the market include patterns like an inside bar, inside-inside, inside-outside-inside, outside bar, tails above and below bars, and small bodies. As a result, traders often choose to wait for a strong close before entering their next trade.
- Patterns
- Market is creating a micro double bottom; if bears are able to offer a firm bear close, a micro double bottom fail pattern would result, which would cause a measured move downward.
- In general, a bull channel is more likely to form following a bear breakout of a bull micro channel than a downturn.
- The market may move swiftly upward if bulls are able to provide a strong bull close because big round number 18000 will function as a magnet, trapping bears who sold for reversal and forcing them to look for exiting their positions.
Market analysis reports archive
You can access all weekend reports on the Market Analysis page.

