Market Overview: Nifty 50 Futures
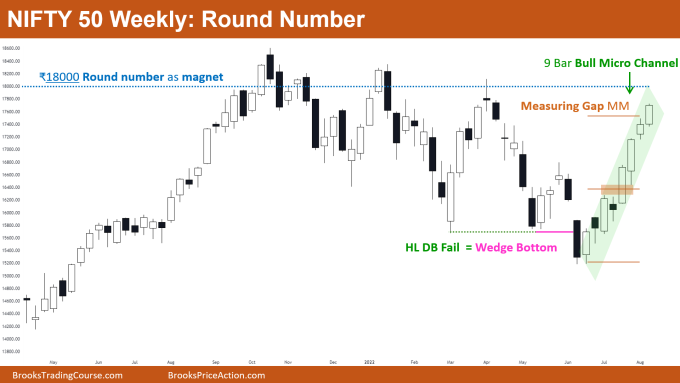
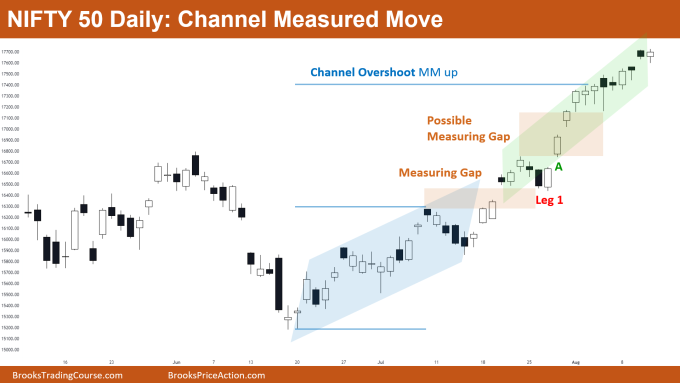
Nifty 50 Near Big Round Number on the weekly chart and also formed a bull bar which continues the bull micro channel, making this move more climatic. Nifty 50 on the daily chart continued up even after reaching the channel measured move up, and thus forming another possible measuring gap (can turn out to be an exhaustion gap as well).
Nifty 50 futures
The Weekly Nifty 50 chart

- General Discussion
- 4 Consecutive Bull Bars make this bull leg more climatic, which means there is a high probability of the market forming at least a small trading range before a successful breakout can occur.
- Bulls would be still buying the closes as there is no sign of reversal, also because bulls know there is a 60% chance of 2nd leg up before any reversal can occur.
- Bulls know this bull leg is very strong, so for reversal the minimum bears want is a micro double top (a form of 2nd leg up in this bull leg).
- Deeper into the price action
- Bulls know that 18000 is a big round number and many bears would be selling higher with limit orders, so most bulls would not be exiting before that.
- Bears also know 18000 is a big round number, so they would not be selling lower. Due to this behavior of both bulls and bears, big round numbers act like magnets.
- Many bulls would be buying the close of the current bar, or the high of the current bar betting that they would at least get a move up to 18000.
- Patterns
- 9-bar micro channel which also means this is a breakout phase, so traders should only look to buy and not sell in the bull breakout phase
- In a bull micro channel, bulls can buy the close of bull bars as well as buy the high of bull bars. They can also buy on limit order below bars (assuming there would be more bulls than bears below bars).
- Market nearing big round number 18000 which acts as resistance as well as a magnet.
- Pro Tip
- Always remember that whenever a double bottom failure fails (shown above in green and pink line) this means the market has formed a wedge bottom.
- Wedge Bottom is confirmed when you get as strong a strong bull close above the pink line, so on getting a strong bull close above the pink line, you have to buy and put your stop below the swing low.
- Minimum target is 2 legs sideways to up. On getting that you can plan for the top of the Wedge Bottom (where the current market is trading).
The Daily Nifty 50 chart

- General Discussion
- Market on daily chart is in a tight bull channel (currently near the top of the channel). Only a 25% chance of Bull Breakout above the channel.
- Market forming another measuring gap (this time a big one) which has a high probability of converting into an exhaustion gap in future.
- Not many bulls booked profit near the measured move of the channel, and the Nifty 50 again started rallying up. Remember it’s a tight bull channel so on getting a bull bar closing near high you just BUY!
- Deeper into price action
- Now look at the broad bull channel (the blue colored), notice that after breaking above the channel, the market tried to reverse back again into the channel (I am talking about Leg 1).
- There was a 75% chance of the market reversing back into the channel within 5 bars (but that didn’t happen).
- Always remember after the bull breakout (overshoot) of a broad bull channel (blue colored), once bears fail to reverse back into the channel (Leg 1) you have to buy on the next bull bar closing near high (Bar A). for a measured move up based on the height of the channel.
- Patterns
- Nifty 50 is forming steeper and steeper bull channels, which is making the market more and more climatic and increasing the probability of a trading range soon.
- The 1st measuring gap formed after the bull breakout of the broad bull channel was small enough, but now the market formed another measuring gap (this time a big one).
- The bigger the measuring gap is, the higher the chances of that being an exhaustion gap.
Market analysis reports archive
You can access all weekend reports on the Market Analysis page.

