Market Overview: Nifty 50 futures
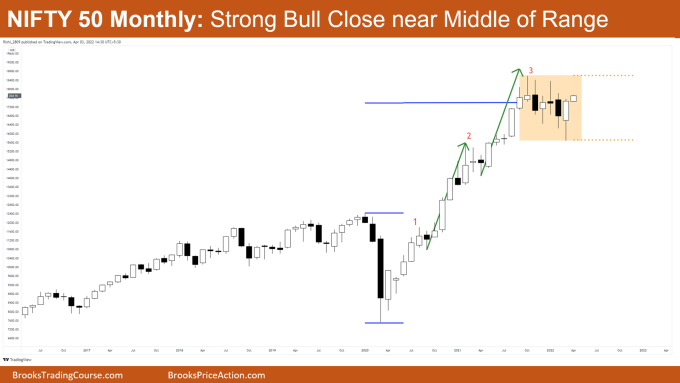
The Nifty 50 futures ended March with a strong bull close in middle of trading range after 5-6 months of indecisive bars. Now the only thing bulls need is a good follow-through bar for continuing the trend again after a long halt, but the bears only need a weak bull close to continue in the trading range for more time.
Nifty 50 futures
The Monthly Nifty 50 chart

- General Discussion
- From September 2021 the market is still not able to test the all time high
- After the pandemic crash the market has seen a good recovery of around 150%
- Deeper into the price action
- NIFTY 50 moved to higher levels with very good bull closes
- Market moved higher with no consecutive bear bars
- Whenever market shows this type of move always remember never sell
- In these types of move you always have to enter on a High 1 or High 2
- Patterns
- After the pandemic bottom market has given a measured move target (marked with blue color)
- NIFTY 50 has also had 3 legs up which clearly tells us market is near the top of a wedge or channel (see the red numbers)
- NIFTY 50 has also given Leg 1 = Leg 2 measured move
- Market is currently trading in a trading range
- Pro Tip (I am not a pro 😅)
- Whenever you see two legs to upside (with strong bull closes in the two legs) then you can buy High 1 or High 2 from the third leg up
- Whenever you see market giving candles with too many tails then avoid entering long / short for some time as this suggests that market is just in a trading range
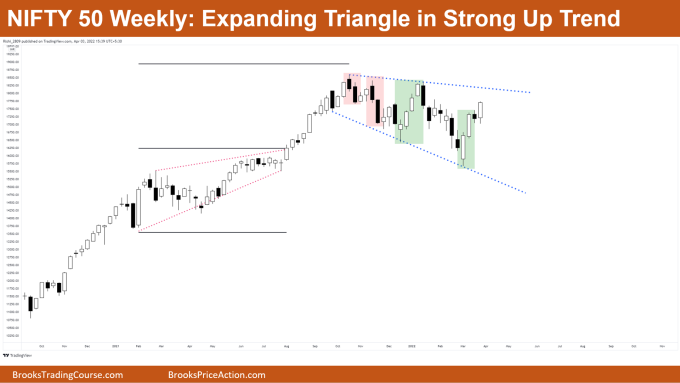
The Weekly Nifty 50 chart

- General Discussion
- From the last two months the market is forming strong consecutive bear bars as well as bull bars
- Limit order bulls buying at the swing lows
- Deeper into price action
- Limit order bulls are able to make money by buying at the swing lows and whenever this happens there are two possibilities…
- If the above structure occurs after strong bull trend and market has already spent time going sideways (like here) then there are higher chances that bulls would be able to get a trend resumption 60% – 70% of the time.
- If above structure occurs in weak bull market then higher chance that bears would be able keep the market going sideways or even make the market trend downwards
- Bulls buying near the swing lows are taking their profits before the SWING HIGHS and this is the sign that bulls are not confident for a bull trend and they assume that market would still be in a trading range
- Limit order bulls are able to make money by buying at the swing lows and whenever this happens there are two possibilities…
- Patterns
- Market completed a measured move target of a rising wedge due to which PROFIT taking came and thus market went sideways
- Market has now entered a downwards expanding triangle
Would you like to chat with Nifty like-minded traders? Then join the Brooks discord server (not managed by BTC site)
Click here to join discord server
Market analysis reports archive
You can access all weekend reports on the Market Analysis page.

