Market Overview: Nifty 50 Futures
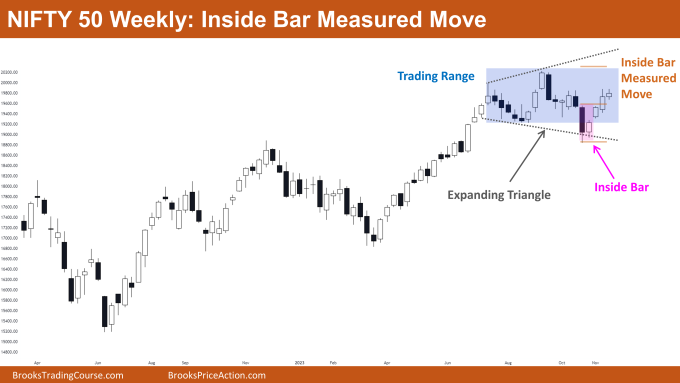
Nifty 50 Inside Bar Measured Move on the weekly chart. This week, the market gave a small bull close, and it is currently trading within the expanding triangle and the trading range. The market is moving closer to the inside bar measured move after the weekly chart of the Nifty 50 showed a bull breakout of the inside bar a few weeks ago. Since the market is moving within a trading range, traders should be prepared for sharp moves on either side. This week’s price action on the Nifty 50 daily chart has been within a trading range.
Nifty 50 futures
The Weekly Nifty 50 chart

- General Discussion
- The market is trading close to the middle of the trading range, and bulls should refrain from purchasing at the current price because it is too far from the closest swing low (for a stop-loss).
- Bull scalpers can buy at this week’s high, set a tight stop-loss at last week’s low, and aim for the measured move of the inside bar measured move.
- Since the market is currently trading close to the middle of the trading range, bears should wait to sell. If bulls are unable to provide a breakout of the trading range, bears may prepare to sell close to the top of the trading range.
- Deeper into the price action
- The market has formed bars with overlapping bodies with other bars during the last 20 bars; this is one indication that the market is in a trading range.
- The Nifty 50 was in an upward trend and has spent the last 20 bars trading within this range. When the market remains in a trading range for more than 20 bars during a trending phase, the likelihood of both a successful bull and bear breakout is almost equal.
- Generally speaking, the likelihood of a successful breakout approaches 50/50 the more bars there are in the trading range following a trend.
- Patterns
- The market has been moving inside an expanding triangle pattern; from the bottom of the expanding triangle, a bull leg has now begun.
- The market has created an additional inside bar pattern this week, which is not indicated on the chart. Should bulls succeed in breaking above the high, this will result in a further measured upward move determined by the height of the inside bar pattern.
The Daily Nifty 50 chart

- General Discussion
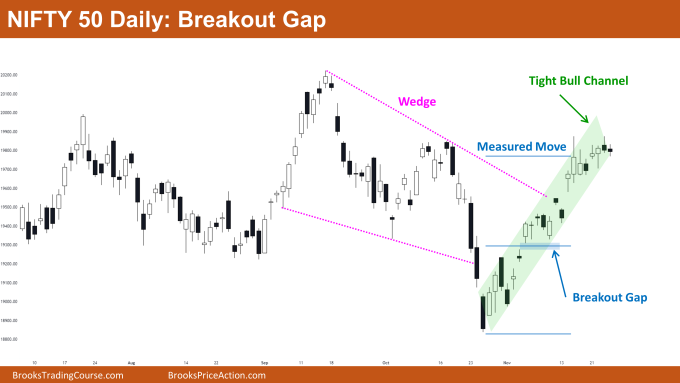
- Bears should hold off on selling until the market reaches the top of the wedge or forms a series of bear bars because the market is currently trading inside a tight bull channel with weak bull bars and frequent bull gaps.
- The market has formed extreme bear and bull legs on the left side of the chart, suggesting that a large trading range rather than a bull trend is more likely.
- Traders with buy positions already in place can hold them until the market hits the wedge’s peak or, if it breaks out ahead of that level, begins to reverse with strong bear bars.
- Deeper into price action
- In accordance with the theory of market cycles, the market typically moves in the following phases: trading range (or breakout mode), which is followed by a breakout that initiates a strong trend that subsequently shifts into a channel (the trend weakens), which subsequently shifts into a trading range 75% of the time.
- Patterns
- The market produced a bear breakout from the wedge bottom, but the bears were unable to make their breakout stick.
- In general, the likelihood of a successful bear breakout for a wedge bottom and bear channel is only 25%, and the same is true for a wedge top and bull channel.
Market analysis reports archive
You can access all weekend reports on the Market Analysis page.

