Market Overview: Nifty 50 Futures
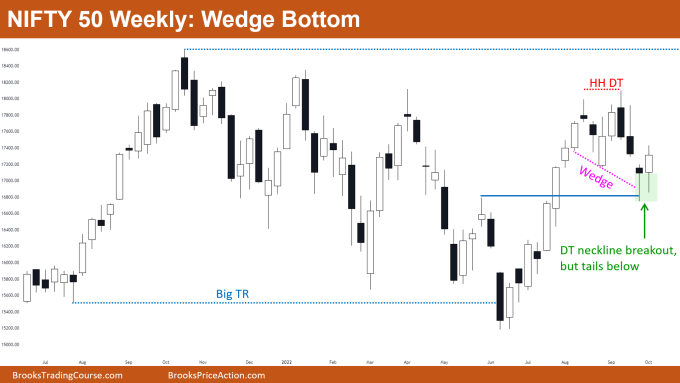
The Nifty 50 on the weekly chart is forming a Nifty 50 futures wedge bottom and trading range price action, with increasing bad follow-through bars and increasing tails above and below bars. The market is also forming reversal patterns which is a sign that market is in a trading range phase.
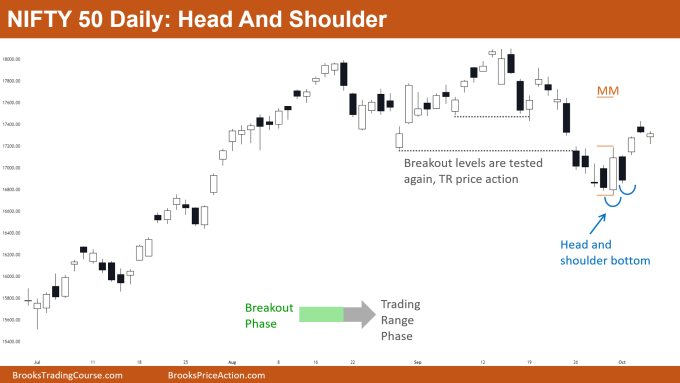
Nifty 50 on the daily chart has transitioned from the breakout phase to the trading range phase. The market has been trading at the same levels for the whole week.
Nifty 50 futures
The Weekly Nifty 50 chart

- General Discussion
- The market is in a big trading range (blue dotted lines) so reversal patterns and fakeouts would be common for upcoming weeks.
- In a trading range, even the strongest looking moves often tend to reverse within a few bars, so traders should focus on quick exits rather than swing their position.
- Deeper into the price action
- The market gave a bear breakout below the double top neckline and now quickly reversing up. This is creating confusion which is the hallmark of the trading range.
- Traders who shorted below bear bars for the double top would be exiting early above this week’s bull bar.
- The solid blue line (in the above chart) acts as a support and the market also forms a wedge bottom, which increases the probability of moving up rather than down.
- Patterns
- There were only 25% chances of the market giving an overshoot of the wedge bottom line, and 75% chances of the market touching the top line of the channel (which it already did).
- The probability of measured move down based on a higher high double top is now very low due to the formation of wedge bottom and support (solid blue line).
- The market is still near the top of the big trading range so traders buying above this bull bar would be exiting with scalpers’ profit rather than swinging their position.
- Pro Tip
- When the market is in the trading range phase (like above) then trading reversals has high probability rather than trading breakouts.
- Similar for trending markets i.e., when the market is in the trending phase, then trading reversal trades is low probability and trading breakout trades gives a higher probability.
- Patterns you can trade when the market is in the trading range phase are:
- Double top
- Double bottom
- Wedge top
- Wedge bottom
- Head and shoulder bottom
- Head and shoulder top
- And all other reversal patterns
- Patterns you can trade when the market is in the trending phase are:
- Triangle Breakout
- Bull flag
- Bear Flag
- Buy The Close
- Sell The Close
- And all other breakout patterns
The Daily Nifty 50 chart

- General Discussion
- Increasing trading range price action daily is seen, bear bars are followed by bull bars.
- The market has transitioned from the breakout phase to the trading range phase, so traders can expect frequent reversals after breakouts of support or resistance levels.
- Traders should not look for holding their positions for a swing, rather they should book quick profits (scalps).
- Deeper into price action
- Market testing breakout levels, like in the above chart, support levels are broken and then tested within a few bars.
- This means that this is a limit order market, which means that bulls are placing buy limit orders below levels and can make money.
- When both bears and bulls can make money, then that is not a strong trend, rather market is just in a trading range, or in a broad bear channel.
- Patterns
- After the bear breakout below the support level, the market is now forming a head and shoulder bottom and can lead to a possible measured move up.
- As already discussed above, reversal patterns work well in trading range phases and breakout patterns work well in trending phases.
- As the market can be in a possible broad bear channel as well, some traders who bought the head and shoulder bottom breakout would be exiting soon, and would not wait for a measured move target.
Market analysis reports archive
You can access all weekend reports on the Market Analysis page.

