Market Overview: Nifty 50 Futures
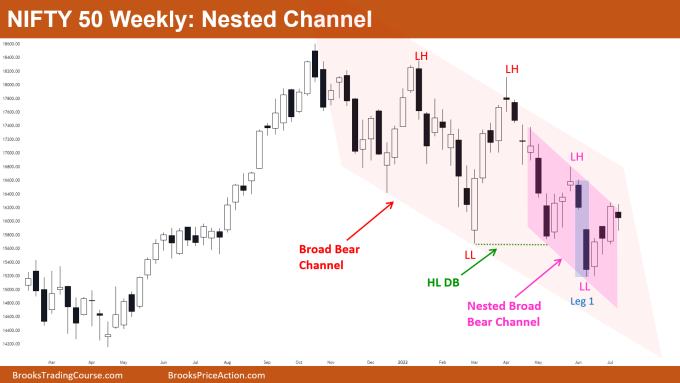
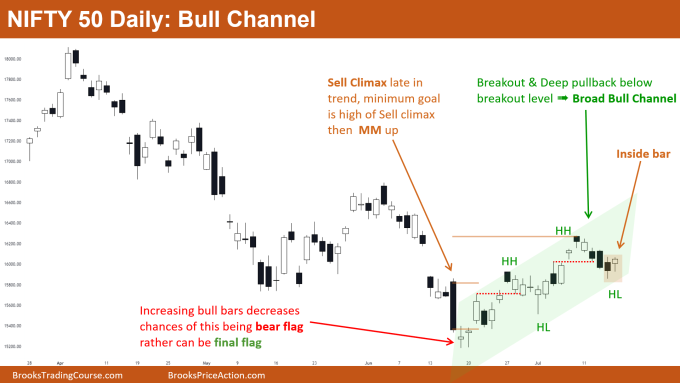
The Nifty 50 on weekly chart gave a bear doji bar which is also an inside bar. Weekly chart forming a broad bear channel and a Nifty 50 futures nested channel, near to top of channel so bears would be looking to short. Nifty 50 on daily chart is in a broad bull channel (more clearly visible on lower time frame) and already achieved Measured Move target of sell climax. Currently near the broad bull channel bottom so bulls look to buy on High 1 or High 2 pullback.
Nifty 50 futures
The Weekly Nifty 50 chart

- General Discussion
- Weekly chart is in bear trend specifically in a broad bear channel. This means both bears and bulls are making money by buying low and selling high.
- Considering both broad bear channels, the Nifty 50 is near top region of channels so Bears would be looking to short on strong Low 2 / Low 1.
- Market gave bear breakout of HL DB (higher low double bottom) which means a DB failure but then market again reversed up (a DB failed failure). So, every time you see a DB failed failure this means market is either in broad bear channel or a wedge bottom.
- Deeper into the price action
- Increasing bad follow through, that is with bull bar followed by bear bar, which means that the bull leg has higher probability to result in trading range rather than trend.
- In the above chart you can see big up & big down moves which is a sign that market is in a trading range. So best strategy here would be buy low sell high and scalp (BLSHS).
- 2nd leg traps are common in trading ranges and in broad channels.
- Patterns
- Take a look at leg 1 (marked in chart) that was a strong bear leg where bears got 2 consecutive bear bars, one closing near low which means this can be start of a sell the close bear trend.
- Due to this, many bears shorted for at least 2nd leg down but they were trapped (a 2nd leg bear trap).
- Once these bears saw the next bull bar closing near high, they would be exiting above the bull bar, which is also a strong High 1 for bulls, so they would be buying as well.
- Pro Tip
- Whenever you start seeing market forming lower lows and lower highs this means that market is in a broad bear channel.
- Channel lines would rarely be perfect so you do not have to find the perfect lines, but rather rely on the basic market structure needed for a broad bear channel – lower lows and lower highs
The Daily Nifty 50 chart

- General Discussion
- Daily chart near bottom of bull channel but the last bear leg was 6-bar bear micro channel which increases the chances of 2nd leg down.
- Bull breakouts in channel are followed by breakout tests which means both bear and bulls are able to make money. This increases the chances of trading range formation in near future.
- Nifty 50 forming inside bar near bottom of channel which can create opportunity both for bears (to bet for failed bull breakout) and bulls (for buying at bottom for successful breakout of inside bar)
- Deeper into price action
- This broad bull channel has higher chances of being the final flag due to following reasons:
- a. Sell climax late in trend,
- b. increasing bull bars, and
- c. Channel up reasonably strong so the best bears would get is a trading range with low probability of bear trend.
- Whenever you get a sell climax late in trend the bulls buy strong High 1 and their minimum goal is top of sell climax. Then if the bull leg was strong, traders target a measured move up based body of sell climax.
- This broad bull channel has higher chances of being the final flag due to following reasons:
- Patterns
- Inside bar is type of breakout mode, and in general breakout mode had 50-50 chances of successful breakout in either direction.
- Location of this inside bar (bottom of channel) improves the odds for bull breakout.
- Similar breakout mode patterns are inside-outside-inside bar, inside-inside bar, outside-outside bar, outside bar… these all have 50-50 chances of breakout.
- So, to get positive traders equation trading above patterns you always have to maintain a Risk to Reward ratio of 1:2.
Market analysis reports archive
You can access all weekend reports on the Market Analysis page.

