Market Overview: Nifty 50 Futures
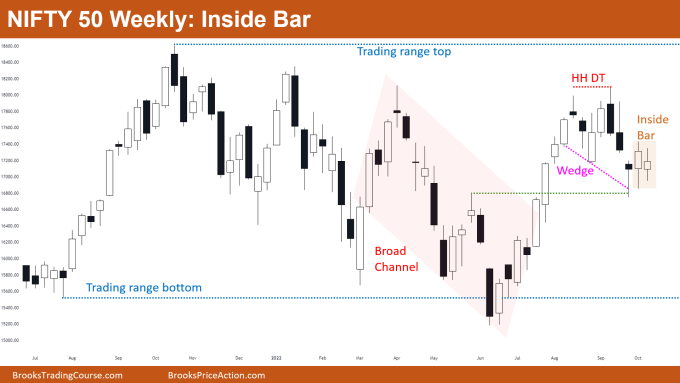
Nifty 50 futures inside bar on the weekly chart after a bear breakout below a higher high double top neckline. Bears would be exiting now and bulls would be buying, so traders would be expecting one leg up.
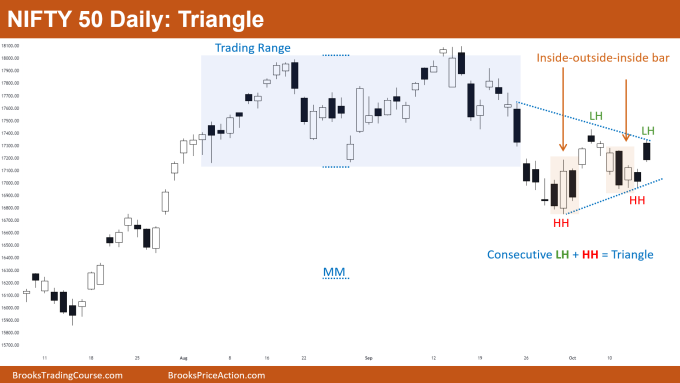
Nifty 50 on the daily chart is forming a breakout triangle (a breakout mode pattern), therefore traders should prefer to wait for the breakout before taking any positions.
Nifty 50 futures
The Weekly Nifty 50 chart

- General Discussion
- The market formed 3 consecutive bad follow-through bars after the bear breakout of the double top neckline, many bears who shorted the bear breakout would be exiting above the high of the inside bar.
- The overall market is currently inside a big trading range so traders should scalp their position, if at all going long around this level (as we are currently around the trading range top).
- The market is following the market cycle i.e. after the breakout of the broad bear channel (red color) now the market is forming more trading range price action which is usually the case. Broad channel → Trading Range → Trend
- Currently, the Nifty 50 is in the Trading Range phase rather than a trend.
- Deeper into the price action
- There is a support level (green color dotted line), wedge bottom, and 3 bad follow-through bars due to which there is a very high chance of buyers above the inside bar high.
- Bears would not be selling again until they see a big and strong bear bar closing near low, but bulls would be buying above the inside bar high for 2nd leg up.
- Patterns
- Nifty 50 is forming an inside bar pattern which is also a breakout mode pattern, this means there are 50-50 chances of successful breakout up or down.
- Due to the context, there are slightly higher chances for a successful bull breakout of this inside bar.
- Most of the time, an inside bar on the higher time frame is a triangle on the lower time frame.
- Pro Tip
- Patterns like
- Inside bar
- Outside bar
- Inside-inside bar
- Inside-outside-inside bar
- Outside-outside bar
- More…
- The above patterns are early signs that the market would soon convert into a trading range, or a reversal would occur soon.
- Patterns like
The Daily Nifty 50 chart

- General Discussion
- Nifty 50 on the daily chart is forming a triangle (this is a breakout mode pattern) after breaking below the trading range (blue box).
- Nifty 50 is forming trading range patterns like an inside-outside-inside bar, inside-inside bar.
- Currently, the market is in breakout mode so traders should wait for the breakout before taking any position.
- Deeper into price action
- Some traders would consider this triangle as a 2nd trading range and call this pattern a trending trading range.
- The high of the 2nd trading range (i.e., triangle) goes above the low of the 1st trading range, which means bears are not that strong, and the market can soon reverse up and enter the 1st trading range.
- Some bears who shorted the bear breakout of the 1st trading range would be waiting for a trading range measured move down.
- Patterns
- How can you identify a triangle?
- Whenever you see 2 consecutive lower lows with 2 consecutive higher highs then you can say this is a triangle.
- Sometimes triangles may not look obvious and lines are not always perfect, that is when these simple rules may help you.
Market analysis reports archive
You can access all weekend reports on the Market Analysis page.

