Market Overview: Nifty 50 Futures
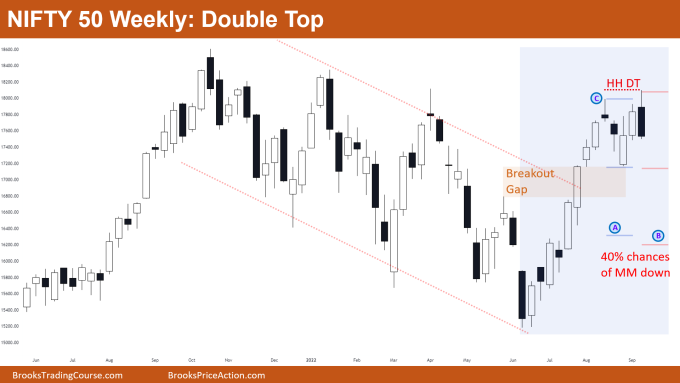
Nifty 50 futures double top on weekly chart with a strong bear bar closing near low. Still, the breakout gap is open which indicates some strength. Currently on the weekly chart, the market is near the trading range top so traders avoid buying this high.
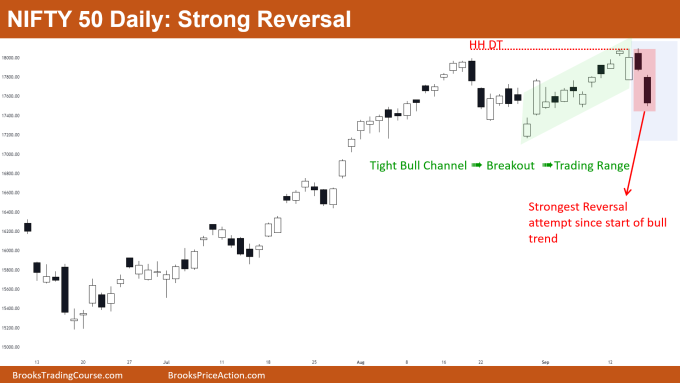
Nifty 50 on the daily chart showed the strongest reversal attempt since the start of the big bull trend. This is a sign of a possible trading range in the future, so traders should be looking to buy low sell high scalp.
Nifty 50 futures
The Weekly Nifty 50 chart

- General Discussion
- This week gave a good close for bears, this week’s bar is a bear bar closing near low, so this would be attracting some bears and some bulls to short the market and book their profits respectively.
- After the breakout of the broad bear channel, this would be the 2nd reversal attempt by bears.
- The market formed a double top and also has an open breakout gap which creates confusion for both bulls and bears. Thus, high probability of trading range in upcoming weeks.
- Deeper into the price action
- The 1st reversal attempts by bears (at C in the chart above) were very weak to cause a bear reversal, due to this, bears were unable to attract more bears to sell.
- This week acted as the 2nd reversal attempt which is stronger than the 1st reversal and has the bear bar closing near low which increases the probability of reversal.
- Conservative traders would wait for one more bar before doing anything. Traders would be noticing this:
- How is the next bar closing: if another bear bar closing near low then bears would be shorting, if a bull bar closing near high then bulls would buy considering this as a bear trap.
- Patterns
- Market forming higher high double top which has 40% chances of a breakout below the neckline and measured move down.
- Traders know the market broke above the broad bear channel thus higher chances of the trading range, so many traders would not prefer buying this high.
- Still, the breakout gap is open so can expect a measured move up based on the measuring gap, but this has a low probability.
- Pro Tip
- When there is a higher high double top then you can consider 2 measured move targets down.
- 1st based on lower high (that is C), the 2nd based on higher high.
- In the above case, you get 2 targets A & B. Many times, the market starts reversing from the smaller target, so it would be better to scale out of the trades based on 2 target levels (like 50% on A and 50% on B).
The Daily Nifty 50 chart

- General Discussion
- The market formed 2 consecutive bear bars closing near its low which means this can be the start of sell the close trend.
- The market showed the strongest reversal attempt since the start of the bull trend.
- 2nd leg up in double top was a strong tight bull channel, after which the market gave a bear breakout.
- Deeper into price action
- As the 2nd leg was a strong tight bull channel, which decreases the probability of reversal, the best bears can get would be a small trading range.
- Sell The Close in a strong bull trend is a good sign for bears, but conservative bears would not sell until the market forms lower lows and lower highs.
- As the bull trend is strong there would be more buyers below the start of the tight bull channel than sellers, so many bulls would be buying with limit orders (which means a possible trading range can form).
- Patterns
- From the last 20 bars, there is an increase in trading range price action, so high probability that this sell the close would be just a bear trap.
- In trading ranges market usually converts into always in long and always in short, so even if the next bar would be another bear bar closing near low, many bulls would buy with limit orders at the bottom of the tight bull channel.
Market analysis reports archive
You can access all weekend reports on the Market Analysis page.

