Market Overview: Nifty 50 Futures
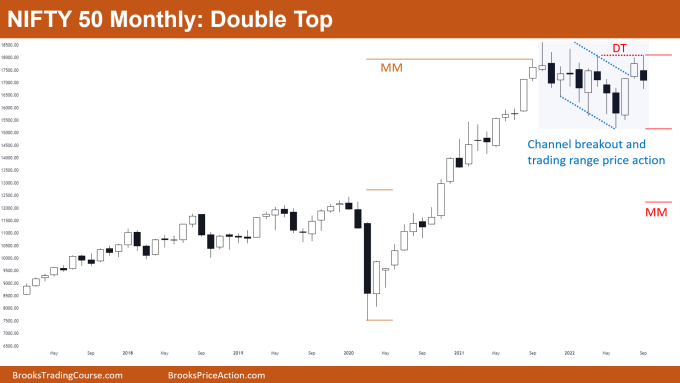
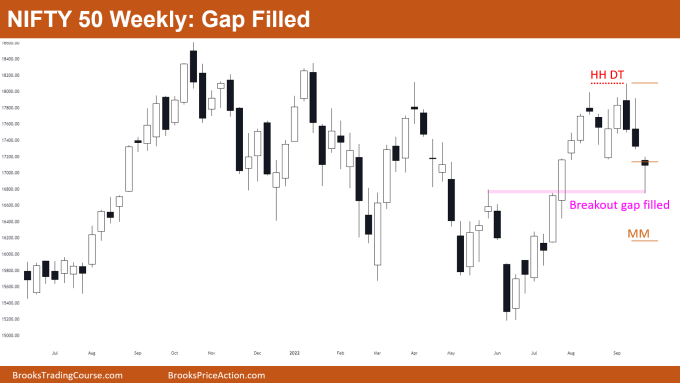
A Nifty 50 double top formed on monthly chart and showed increasing trading range price action after the breakout of the small bear channel. Market is trading in the current range for the last 10 months now. Nifty 50 on the weekly chart has filled the breakout gap, so now less probability of the market going for measuring gap up. The market formed 3rd consecutive bear bar but this week’s bar is a weak bear bar.
Nifty 50 futures
The Monthly Nifty 50 chart

- General Discussion
- After reaching a measured move up (brown color) market is in a trading range for the last 10 months. Traders should only focus on buying low sell high until a breakout occurs.
- Market following market cycle i.e., trend phase then channel which is followed by a trading range. Currently the market has entered trading range phase after the breakout of the channel.
- Some aggressive bears would be selling below the current bear bar for the double top and measured move down.
- Deeper into the price action
- In the blue box (above image) market is forming tails below and above with bad follow-through after each bar. This is the hallmark of a trading range (or broad channels).
- There are still higher chances of the market giving a bull breakout of this trading range (as only 10 bars are in the trading range).
- In general, after 20 bars in the trading range, there are equal chances of bull breakout and bear breakout of the trading range.
- Patterns
- The market formed a double top, therefore 40% chances of a bear breakout and measured move down.
- Some traders sell below the bear bar and put their stop above the bar and aim for at least a 1:2 Risk-to-Reward for positive traders equation.
- Pro Tip
- As a trader, your aim should be to get a positive traders equation, so before taking any trade you have to decide on an appropriate risk to reward for the given probability of the pattern.
- Example: If you take the double top short (double top in the above image) then you should follow the steps below before taking the trade:
- Identify the probability of the pattern: in general, for a double top, there is a 40% probability of the market giving a bear breakout and measured move down.
- Find out what risk to reward you need for the positive trader’s equation: As the probability of success is 40%, so for the positive trader’s equation you cannot trade this for 1:1 rather you have to go for a minimum of 1:2 Risk to Reward.
The Weekly Nifty 50 chart

- General Discussion
- Nifty 50 filled the breakout gap (if you want to know what the probability of breakout gaps filling, then take a look at last week’s blog).
- The market is still in the big trading range, so traders looking to buy low sell high.
- A bear breakout below double top neckline did not get good follow through but filled the breakout gap, which is both a positive for bulls and bears respectively (Confusion = Trading Range).
- Deeper into price action
- Prominent tails above and below from last 2 bars (bear bars) are a sign that the market is in trading range price action.
- When taking trades in a trading range, then prefer wide stops above swing highs and swing lows to avoid getting stopped out (as pullbacks are common in a trading range).
- When the market reached the breakout gap level, bulls started buying aggressively and trapped bears who sold at this level exited their shorts at breakeven. This was confirmed as the bear bar had a long tail below.
- Patterns
- Nifty 50 forms a higher high double top, therefore 40% chance of the measured move down (shown in brown color).
- A market-filled breakout gap, but still looking bullish as more buying pressure at the breakout level.
- Traders must carefully watch what market forms next. Would that be a strong bear bar (in that case the high probability of the market reaching a measured move down), or would that be a strong bull bar (in that case market would enter a small trading range within this large trading range).
Market analysis reports archive
You can access all weekend reports on the Market Analysis page.

