Market Overview: Nifty 50 Futures
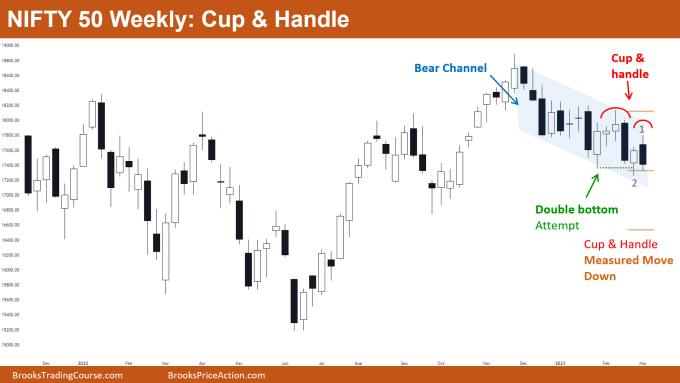
Nifty 50 cup & handle on the weekly chart, bulls failed to follow through after attempting a double bottom. Now that bears have closed a strong bear bar, some bears may decide to short the cup & handle pattern on the weekly chart.
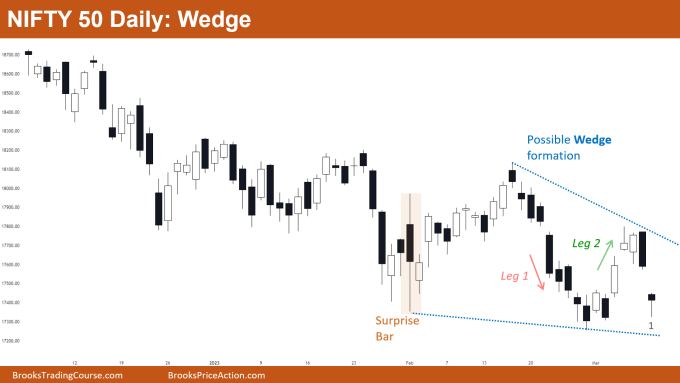
On the daily chart, price action is contracting and the market is attempting to form a falling wedge. As the market is in a trading range price action phase, traders should not swing their positions; instead, they should look for quick exits.
Nifty 50 futures
The Weekly Nifty 50 chart

- General Discussion
- The majority of bulls would not be buying at the current levels because bar 1 was a poor follow-through bar after the double bottom attempt, which has diminished their interest.
- For a double bottom fail and cup & handle top, bears would be selling at or below the low of bar 1.
- The majority of bears would maintain their stop at the high of bar 1, as this implies a trading range rather than a second leg down if the market trades above bar 1’s high.
- Deeper into the price action
- The Cup and Handle pattern is a breakout mode pattern, which means that the chances of a successful breakout are approximately 50%. In the example shown above, the bars on the left indicate trading range price action, so the chances of a successful breakout are even closer to 50%.
- Patterns
- A bear breakout from a bear channel has a 75% chance of failing after a few bars with the market returning to the bear channel.
- A risk-to-reward ratio that is strictly greater than 1:1 is required for bears to short at the low of bar 1. (1:2 is preferred).
- This is due to the fact that a higher risk-to-reward ratio is required when trading patterns like cup and handle, where the probability of success is around 50%.
The Daily Nifty 50 chart

- General Discussion
- Bears should avoid shorting close to bar 1, as there is little room for profit because the market is trading close to the wedge’s low.
- Some bulls might consider buying above bar 1 or watch for a bull bar in order to gain a small scalp.
- Because the market is currently in a trading range, traders should look to lock in profits rather than trying to swing their positions.
- Deeper into price action
- Pay attention to leg 1, which has nine straight bear bars and is a very strong bear leg. But the market then created leg 2 (strong bull leg).
- Leg 1 convinced many bears to short on Low 1 for the second leg down, but leg 2 let the bears down. Many bulls were convinced by leg 2 to purchase on High 1 in anticipation of a second leg up, but even the bulls were let down by the poor follow-through.
- When both bulls and bears are disappointed then this generally suggests that market is now trading inside a trading range or a breakout mode pattern.
- Patterns
- The market has been showing a lot of trading range price action since the big surprise bar.
- Avoid taking positions as the market approaches the apex; instead, look for the next breakout.
- This is due to the fact that as the market approaches the apex, the potential for profit declines and uncertainty rises, which frequently causes a negative traders equation for the majority of traders.
- In order to avoid being forced out of a trade, traders who want to buy at the high of bar 1 should NOT place their stop at bar 1’s low but rather at the low of the closest swing low.
Market analysis reports archive
You can access all weekend reports on the Market Analysis page.

