Market Overview: Nifty 50 Futures
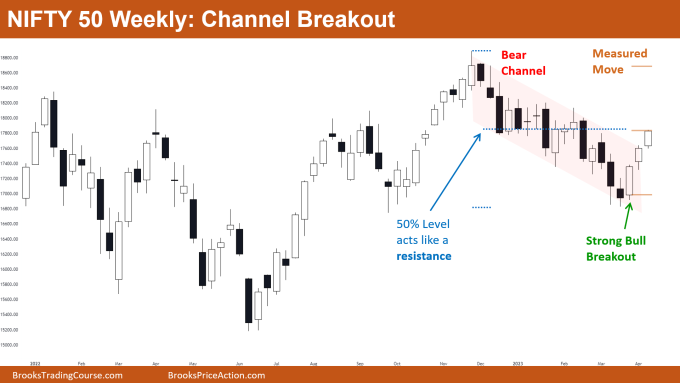
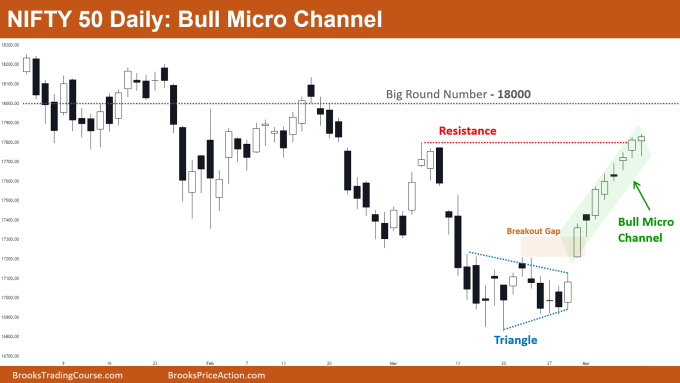
Nifty 50 channel breakout on the weekly chart. On the weekly chart, the market gave a strong bullish close, continuing the bulls’ attempt to reverse the trend. At the moment, the market is trading close to the 50% pullback of the bear channel, which might act as a level of resistance. The big round number 18000 is also acting as a magnet for the price, and the last five bars have very small bodies, which could signify a loss of momentum and a potential pullback. Bull micro channel on the daily chart.
Nifty 50 futures
The Weekly Nifty 50 chart

- General Discussion
- This week’s market saw the formation of another strong bull bar that is closing close to its high. Bears should hold off selling the market until they see some more strong bear bars because this bull leg is extremely strong.
- Bulls need a strong follow-through leg up for a successful breakout, so many bulls would be buying first and second entry buy entries.
- Deeper into the price action
- Because the bulls are making a strong attempt to reverse the trend, the best the bears can hope for in the coming bars is a trading range.
- The price would encounter resistance because the market is currently trading close to the bear channel’s 50% pullback level.
- Aggressive bulls would buy at the high of the most recent bull bar, while conservative bulls would prefer to buy on a pullback.
- Patterns
- According to the market cycle, the market has given a bull breakout of the bear channel, indicating that there is a higher likelihood that the market will transition into a trading range.
- As the market showed a strong breakout with three straight bull bars, this possibly lead to a measured move up based on their bodies (represented by brown lines).
The Daily Nifty 50 chart

- General Discussion
- Because the market is trading inside of a bull micro channel, there is no room for sellers to make a profit. If the market is trading inside a tight bull channel or a bull micro channel, sellers should refrain from selling the market.
- The bull bars’ bodies are getting smaller, which suggests that bulls are losing interest. This could be because the market is approaching a resistance.
- Deeper into price action
- The market is currently trading close to the big round number, which acts as a price magnet.
- The fact that the breakout gap is still open indicates the strength of the bulls.
- According to the market cycle: bull micro channel → tight bull channel → broad bull channel → trading range.
- Patterns
- A bull micro channel is a bull channel in which the price never trades below the low of the previous bar, meaning that the previous bar’s low is lower than the bar’s subsequent low.
- This bull micro channel will change into a tight bull channel if any bar begins trading below the low of any prior bar.
- Remember! When the market is trading inside a bull micro channel, a bear cannot sell and make money. For beginners, trading a tight bull channel profitably may be challenging, but trading a broad bull channel profitably would be much simpler.
Market analysis reports archive
You can access all weekend reports on the Market Analysis page.

