Market Overview: Nifty 50 Futures
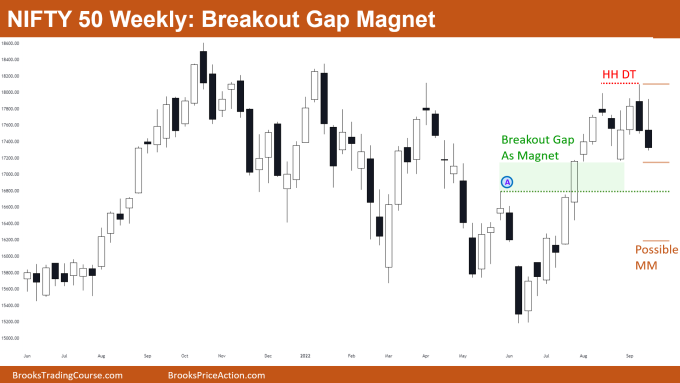
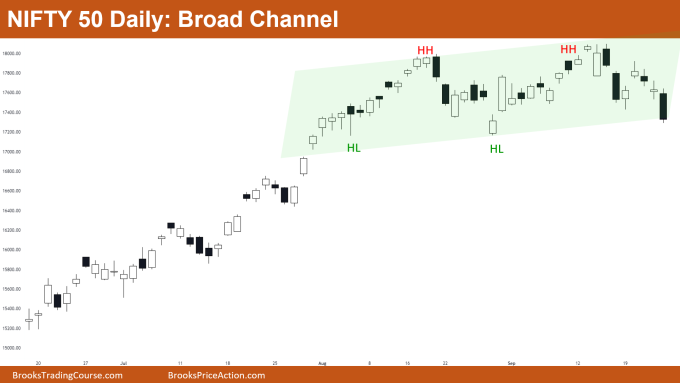
The Nifty 50 on the weekly chart has a breakout gap open, which acts like a magnet. This week gave a bear bar closing near its low, and now we have 2 consecutive bear bars closing near their lows, which increase the chances of at least one more leg down. Nifty 50 on the daily chart is in a broad bull channel as the market makes higher highs and higher lows, bulls would be looking to buy near the bottom of the channel.
Nifty 50 futures
The Weekly Nifty 50 chart

- General Discussion
- After giving a strong breakout above level A (shown in the chart) the market never tested that level again i.e., formed a breakout gap.
- Another bear bar closing near its low increases the probability for 2nd leg down. Also the market is near a big trading range top so probability favors bears.
- Since the bull leg in this big trading range was very strong, some bears would avoid selling until they see more strong bear bars closing near their lows.
- Deeper into the price action
- 2nd leg up in higher high double top was strong, this decreases the probability of bear breakout of the double top neckline and measured move down.
- In general, there is a 40% chance of a bear breakout and measured move down for a double top, so you should maintain at least a 1:2 Risk to Reward for positive traders equation.
- 2nd bear bar after the double top has a tail above, which means the market currently is in a trading range mode rather than a start of a strong trend.
- Patterns
- Open breakout gap which is acting like a magnet.
- As this gap acts as a magnet, this increases the probability of bear breakout of the double top.
- Pro Tip
- Whenever breakout gaps form in a trading range environment like the above then they have a high probability of being filled soon.
- Example: If the market formed a bull breakout gap (not filled) in the trading range, then selling near the top of the trading range would be reasonable.
- But when breakout gaps form in a bull trend, then you should not be selling, because in trending markets breakout gaps improve the strength of a trend and not as a magnet.
The Daily Nifty 50 chart

- General Discussion
- Market forming higher highs and higher lows which means the market is in a broad bull channel.
- Currently, the market is near the low of the broad bull channel which means there would be bulls buying below bars assuming they would get 2 legs up in this channel.
- The best bears can get for now is a trading range until the market forms strong consecutive bear bars.
- Deeper into price action
- Look at the price action in the above broad bull channel, there are:
- Small bear and bull bars
- Bad follow through after strong bull or bear bars
- Bars have tails above and below
- This is trading range price action which is very common in broad channels, so your goal should be buying low and selling high.
- Ways you can enter a trading range or broad channels:
- Buying below swing lows with limit orders
- Buying High 1 near trading range bottom
- Buying High 2 near trading range bottom
- Buying on big bull bar closing near high near trading range bottom
- Buying on small consecutive bull bars near trading range bottom
- Look at the price action in the above broad bull channel, there are:
- Patterns
- Higher Highs and Higher Lows therefore a broad bull channel.
- Broad bull channels have trading range price action thus you trade them like a trading range, i.e., buy low sell high scalp.
- A broad Bull Channel late in a bull trend can act like a final flag, so traders looking to sell on a strong bear breakout of the broad bull channel.
Market analysis reports archive
You can access all weekend reports on the Market Analysis page.

