Market Overview: Nifty 50 Futures
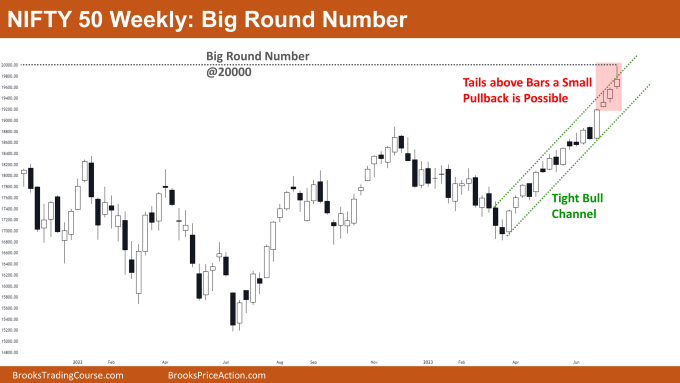
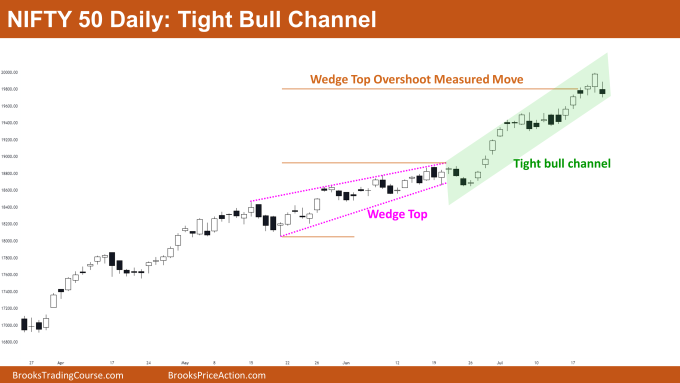
Nifty 50 Big Round Number on weekly chart. This week, the market had come close to the @20000 level but ran into strong resistance, creating a long tail at the top of this week’s bull bar. The market is trading inside of a tight bull channel on the weekly chart, but traders can expect a slight pullback because of the formation of tails above recent bars. This week, the Nifty 50 on the daily chart overshot the measured move target for the wedge top, and the market is also trading inside a tight bull channel.
Nifty 50 futures
The Weekly Nifty 50 chart

- General Discussion
- Bulls who are already long should keep their trade open. This is due to the market’s recent inability to form a strong bear bar, which makes the likelihood of a reversal quite low.
- This suggests that bears shouldn’t be selling as a result. Some bears (scalpers) might sell at the low of the most recent bull bar for a small profit, which they might book close to the bottom of the bull channel.
- Bulls can enter the market at different levels because the market is in a strong bull trend. For instance, waiting for a high-1 signal bar or using a buy limit order at the low of a bull bar are both viable options.
- Deeper into the price action
- Pay attention to the last three bull bars. Two of them have tails on top, and you’ll also notice that their bodies are relatively smaller than those of the previous bars in the trend.
- These could be a sign that the market may soon experience a slight pullback.
- Because the bull trend is so strong, there is a greater likelihood that the first pullback will be a small one.
- Take note that bulls typically look to buy on the high-1 or high-2 entries following a strong bull leg, so you can anticipate at least another leg up before any reversal.
- Patterns
- The market is currently trading close to a large round number that serves as a significant resistance level for the market.
- Take note that the market is currently trading close to the top of a tight bull channel, which may tempt some bear scalpers to sell at the bar’s low and exit near the bottom of the trend channel for a small profit.
The Daily Nifty 50 chart

- General Discussion
- The market is currently trading at the tight bull channel’s bottom trend line. Before any reversal, traders anticipate a second leg up.
- Bears should wait to sell until they see several strong bear bars in a row.
- Bulls who aren’t long may want to hold off on buying until a slight pullback occurs on high-1 or high-2 entry bars. It is best to keep your stop loss at the closest swing low in strong bull trends like this one.
- Deeper into price action
- This week, the market attained the wedge top overshoot measured move target. The bear bodies are still quite small, as you can see.
- This suggests that there aren’t enough bears willing to sell the market.
- The recent pullbacks on the above chart are very weak in comparison to the bull legs; therefore, traders should refrain from selling until bears are able to form a strong bear leg that is comparable to the strength of the bull legs.
- Patterns
- The market is currently trading within a tight bull channel and also created a few breakout gaps on its ascent.
- These breakouts are a sign of strength and serve as a price support level.
- The market has reached two critical levels: the measured move target and the big round number (20000), which will act as price resistance in the coming week.
Market analysis reports archive
You can access all weekend reports on the Market Analysis page.

