Market Overview: Nifty 50 Futures
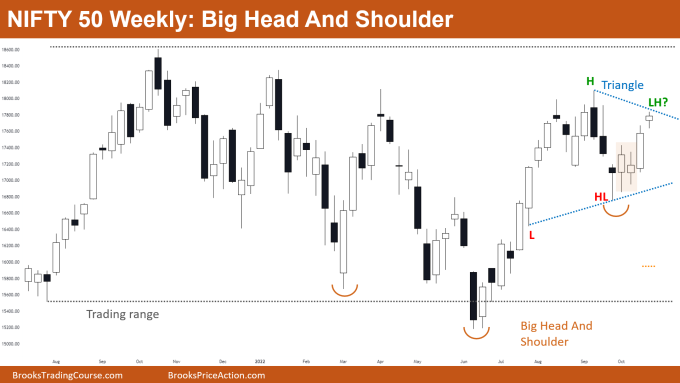
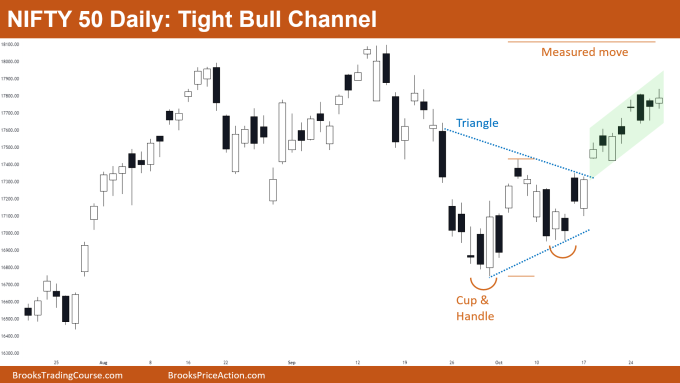
Nifty 50 on the weekly chart forming a big head and shoulder pattern and currently market going sideways and forming a triangle (right shoulder). Aggressive traders would go long before a triangle breakout as this is also a head and shoulder. The market on the daily chart is forming a tight bull channel, measured move of the cup & handle pattern and triangle pattern is pending.
Nifty 50 futures
The Weekly Nifty 50 chart

- General Discussion
- The market is still in a breakout mode pattern (triangle) so most traders would prefer to wait before taking any positions.
- The weekly chart is in a big trading range (black dotted lines) and the current market is near the trading range top, so traders would hesitate to buy near these levels.
- Traders who went long when the market was near the trading range bottom would be exiting now, because the market is near the top. When trading in the trading range, traders should follow a buy low sell high scalp strategy.
- Deeper into the price action
- Within the last 10 bars on the chart are inside-inside bars, doji bars (bars with tails), and bad follow-through bars (big bull bars followed by small bull bars). This increases the probability of the market going sideways for a few more bars.
- When the market is showing trading range / sideways price action then it is more reasonable to take scalp trades rather than taking swing trades.
- Patterns
- Whenever the market forms consecutive higher highs and consecutive lower highs then this confirms a triangle, but in this case, 2nd lower high is not yet formed.
- Triangle is a breakout mode pattern thus there is a 50-50 chance of a successful breakout on either side.
- Pro Tip
- Whenever you trade breakout mode patterns (where chances of a successful breakout are 50-50) then to get positive traders equation you should maintain at least 1:2 risk to reward.
- In general, when you take a trade (in direction of the trend) when the market is in the trending phase then you can have a 1:1 risk to reward. But when you take any trade when the market is in a sideways phase (i.e., 50% chances of a move to either side) then you must have 1:2 risk to reward for positive traders equation.
The Daily Nifty 50 chart

- General Discussion
- The market on the daily chart is forming a tight bull channel after a breakout of a triangle.
- As the market is in tight bull channel, bears would not prefer to sell until they see strong consecutive bear bars and bulls would be ready to buy below bars.
- A measured move of a cup & handle is pending due to which many bears avoid selling and bulls prefer to hold their longs until the market reaches the measured move.
- Deeper into price action
- The market is allowing very small pullbacks which means there are many limit order buyers below the bars.
- When the market is in tight bull channel, bears do not prefer selling with limit orders above bars, this is because pullbacks are very small (even for a scalp trade).
- The market is in a tight bull channel but forming many bear bars and weak bull bars within the channel. This increases the probability of a sell-off when the market reaches the measured move (of cup & handle).
- Patterns
- Whenever market forms a cup & handle there is always a triangle (as for a cup & handle there are always 4 legs within it and also pattern converges near the end).
- Traders who bought the breakout of the triangle would be trailing their stops near the neckline of the cup & handle. This is because if the market breaks below the tight bull channel then it would signify that market has now turned into a small trading range (which bulls do not want).
Market analysis reports archive
You can access all weekend reports on the Market Analysis page.

