Market Overview: NASDAQ 100 Emini Futures
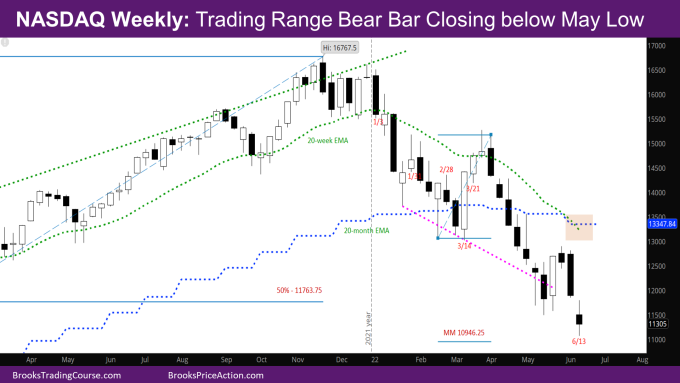
Nasdaq trading range bear bar candlestick closing below last week’s low, but with tails above and below.
The week opened at the May low and closed lower for the 1st two days of the week. Wednesday was a trading range day but with bull body in the middle, which means likely sellers above. Thursday gapped down and closed a bear day with a tail on the bottom. Friday was another trading range day with a bull body and tails on both top and bottom.
NASDAQ 100 Emini futures
The Weekly NASDAQ chart

- This week’s bar is a trading range bear bar which means more sideways than up in coming weeks.
- The close below last week’s low is a sign of strength for bears, while the tails indicate trading range price action.
- The market went below one of the targets mentioned in previous reports – open of November 2020 month at 11139.5 and bounced.
- November 2020 is when the spike on monthly chart started after the sideways months of September and October. This will be an interesting place to see if bulls come in since some of them will have stops just below the November month, or the September month (which was an outside bar to the entire four month sideways move).
- The other target for the bears is the measured move (MM) down of the double bottom (DB) on monthly chart at 10946.25. This is right around the low of the November month mentioned above. The market is close enough that it should meet the 10946.25 target.
- The priority for bulls is to form good bull signal bars in the coming weeks. Their challenge is that since the 2nd bear leg that ended in May is so steep, its unlikely that the bulls will be able to reverse as a truncated wedge (i.e., the 3rd leg is much smaller compared to the 2nd leg).
- The bears who sold higher can also move their stop above the most recent high especially if next week is a follow-through bear bar. This would be another reason for bears to sell more next week.
- The Weekly EMA has crossed below the monthly EMA. The last time the weekly EMA crossed below the monthly EMA was during the 2008 financial crisis.
The Daily NASDAQ chart

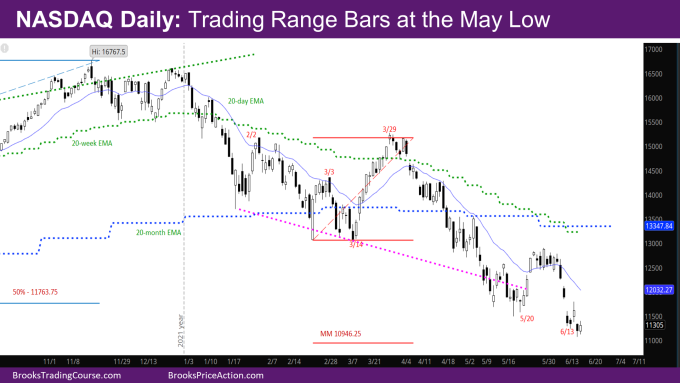
- Friday’s NQ candlestick is a trading range bull bar with tails on top and bottom.
- The market went below May’s low to start the week, but then closed that gap. Bulls who scalped below the May low made money. On Thursday, it tried closing the gap with the low of last week, but sellers came in before that resulting in a big tail on the top.
- The bear leg last week was so steep, that the market will likely have to go down before bulls can attempt a credible reversal.
- Since everyone can see the lower targets mentioned in the weekly analysis, the market could make a quick sell vacuum test of those targets and then reverse.
Market analysis reports archive
You can access all weekend reports on the Market Analysis page.

