Market Overview: NASDAQ 100 Emini Futures
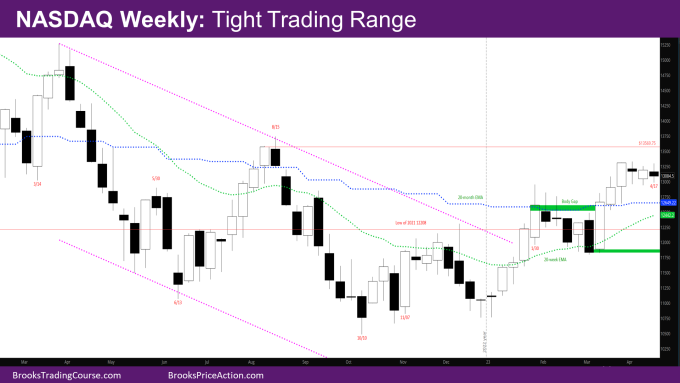
The NASDAQ Emini futures market is essentially in a Nasdaq tight trading range for the past 3 weeks. It triggered the High 1 bull reversal bar of last week and ended as a small bear bar with tails above and below.
Next week is the last week of the month. So far, the month is a small bar near the high of March. If next week is sideways as well, the month will end up as the smallest month since 2019.
NASDAQ 100 Emini futures
The Weekly NASDAQ chart

- There is not much new this week.
- As was likely, the market triggered the High 1 buy signal bar of last week but reversed from around the high of past 3 weeks.
- The market is in a tight trading range for past 3 weeks – Traders are buying near the low of prior week and selling near the high.
- The problem for the bulls is that they don’t have consecutive bull bars anymore.
- In other words, after the strong move up in March, the last 3 weeks have been a weak doji bear bar, a bull bar, and a weak bear bar.
- If bulls need this leg up to continue strongly, they need consecutive bull bars. Otherwise, it becomes a leg in a trading range.
- The next bull target is the close of Week of 8/8 at 13569.75 – the last bull bar of the micro channel up in August. That was a reasonable buy the close bar, and there are trapped bulls up there.
- The market is close enough to this target that it should reach it.
- There is also a body gap created by the week of 1/30 – There has not been a bear close after the market broke above the close of 1/30 that overlaps with the body of 1/30.
- If the market goes sideways for a few weeks, bears will try to get a leg down like they did at the end of the first leg up in early February.
- The first target for bears will be to close the body gap by going below close of 1/30 – 12613.25
- As strong as the move up since October, since the reversal did not start with a bull signal bar, this is still likely a minor reversal, and the market may have to test back down again even if after 6-10 months.
The Daily NASDAQ chart

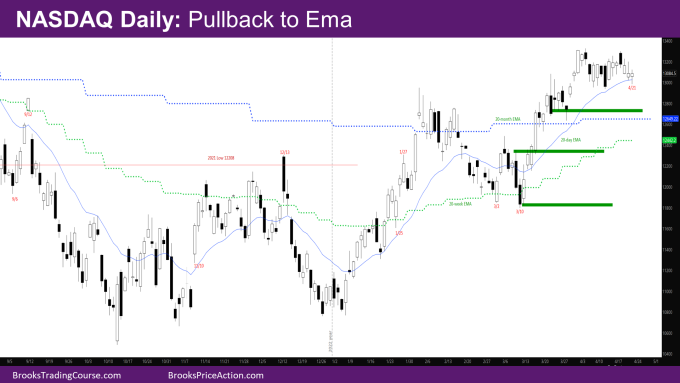
- Friday was a bull doji bar at the exponential moving average (EMA).
- This week was a continuation of the tight trading range (TTR) from last week.
- The market was going sideways for the exponential moving average (EMA) to catch up.
- The bulls will try for another leg up.
- When there is a bigger pullback, some of the possible targets and areas of support are shown in the chart.
Market analysis reports archive
You can access all weekend reports on the Market Analysis page.

