Market Overview: NASDAQ 100 Emini Futures
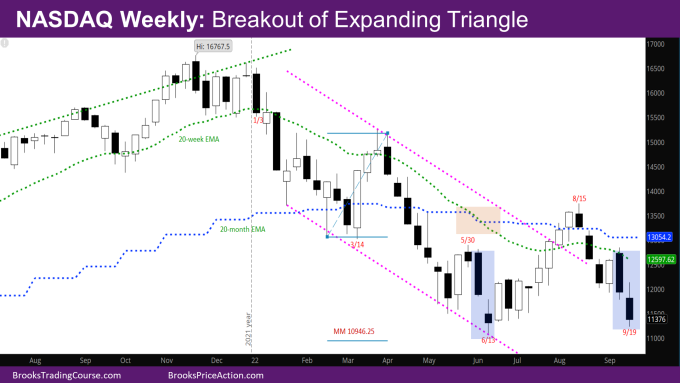
The NASDAQ Emini futures market continued the second leg of its pullback by breaking out below the expanding triangle (ET) of the last 3 weeks and is back near June low support.
The market should test below the June low to see if there are buyers or sellers. The market is an expanding triangle since early May, alternating with new lows, and highs, which is one reason to believe the market will make a new low.
It is more likely that there are more buyers than sellers below the June low, as buyers have been buying below every low so far and making money.
Next week is the last week of the month and will determine the monthly bar. So far, the month is a bear trend bar closing near its low. The bulls want to put as big a tail at the bottom, while the bears want a close near its low. Since we are in a trading range on the monthly chart, near the low of the July month, which was a strong bull bar, it’s more likely the bears will be disappointed.
NASDAQ 100 Emini futures
The Weekly NASDAQ chart

- This week’s Nasdaq Emini candlestick is a bear trend bar with a bigger tail at the top and a smaller tail at the bottom.
- The market went below the lowest weekly close of the year (close of 6/13).
- Now that the market has broken below the expanding triangle (ET) of past 3 weeks, will it get a follow-through bear bar?
- Since the market is near the prior lows, it will also need a strong close below those lows for traders to believe the market will go down further.
- If the market goes below the prior June low, it is likely to find buyers there. The reason why there should be more buyers is that the market went far above the last swing high (week of 5/30) during the bull leg of July-August. The bulls not only controlled price during that bull leg, but also time – they had three bull closes above the swing high of 5/30. Usually when this happens, there are buyers below prior lows.
- The last two weeks could be like the first two weeks in June (shaded in light blue), and may give an idea of the price action to follow.
- Unless the market breaks strongly below June with follow-through, it’s more likely for the market to go sideways for the next few weeks. The bulls will need at least two small legs sideways/down – a wedge bull flag with a good-looking bull reversal bar around the same level as the 6/13 reversal bar. This could then lead to a second leg of the move up in July.
- The bears would like a double top (DT) bear flag with May high, with the neckline around July low, and a measured move (MM) down. This is less likely.
- More likely, bears will need a wedge bear flag around the August high, to then have a leg down corresponding to the strong move down in May.
- This wedge bear flag could take the rest of the year to form, and the leg down from there corresponding to the leg down in May could happen early next year.
- Minimally, bears would like to make their target at the MM down of the February-March double bottom (DB) on monthly chart with target at 10946.25. This is right around the low of the November 2020. This is now a realistic target.
The Daily NASDAQ chart

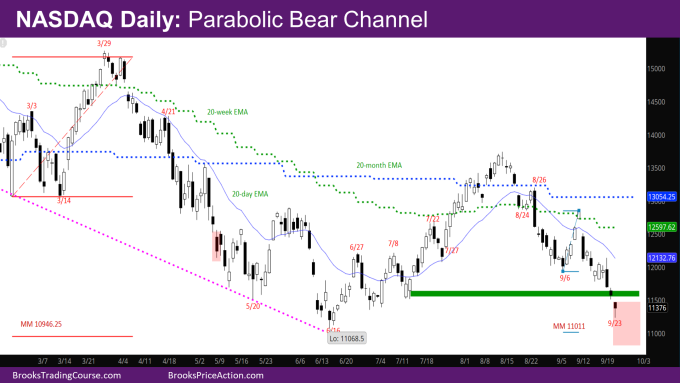
- Friday’s NQ candlestick is a bear reversal bar with a tail at the bottom.
- This week had two sideways days on Monday and Tuesday and a big outside bear spike Wednesday (FOMC statement day) with follow through on Thursday.
- On the daily chart, the market is making a parabolic channel down since last week.
- Given how tight this channel is, there is likely one more leg down.
- The market may be at a similar point as 5/9 (shown in light red on the chart) on its way down and the next couple of weeks could look like the days following 5/9.
- The market pierced through what was shown as the next reasonable area of support in the green zone on the chart last week.
- One reasonable target given the MM of the right shoulder shown in the chart is around 11011.
Market analysis reports archive
You can access all weekend reports on the Market Analysis page.

